
Inventory
Track every dedicated server, blade, chassis, network device, and PDU you own — with specs, location, rack position, status, and bulk add, fetch, and export tools.
What the Inventory page is for
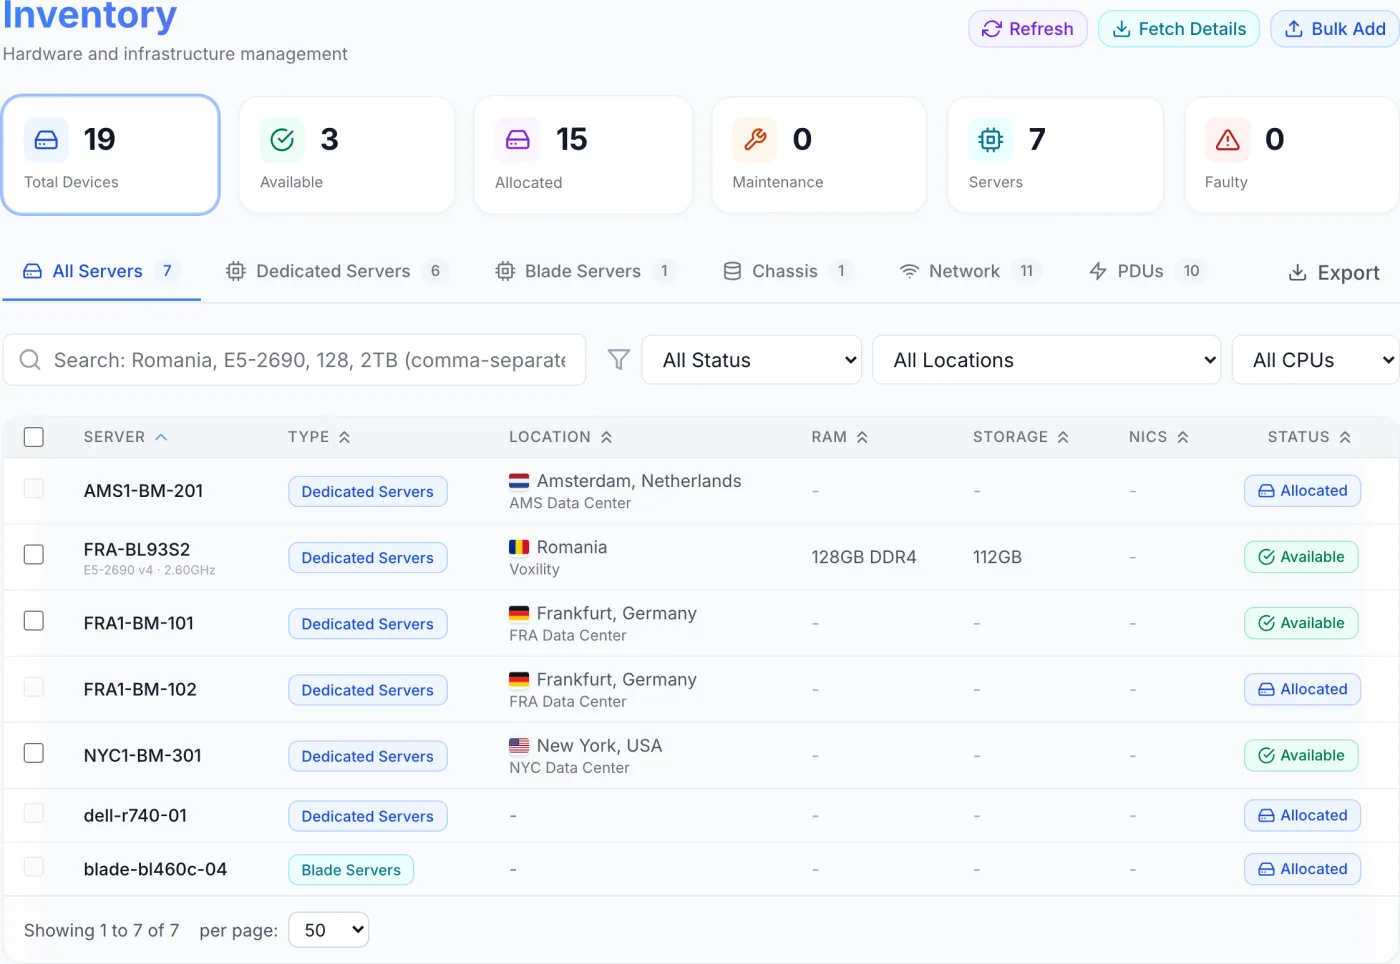
The Inventory page is your hardware asset register. Every physical device you own — dedicated servers, blade servers, blade chassis, network switches, routers and firewalls, and power distribution units (PDUs) — is recorded here with its model, specifications, serial number, location, rack position and current status. It is also the pool that dedicated-server orders draw from when a machine has to be assigned to a customer. The page header reads Inventory — Hardware and infrastructure management.
How to reach it
Open the admin sidebar and choose Inventory (the hard-drive icon). At the top right of the page you will find the Refresh, Fetch Details and Bulk Add buttons; an Export button sits to the right of the type tabs.
Note: The Inventory entry only appears when the Inventory module is enabled for your company and your staff role carries the permission to view inventory. The same module controls the Bare Metal section of Settings, which holds OS Images and Deployment Templates.
Where a device sits
A device belongs to a rack, a rack to a datacenter, and a datacenter to a location. That chain is built on the Locations pages, and it is what gives a device its location. A device that has never been placed in a rack shows a dash in the Location and Rack columns — and, importantly, cannot be picked automatically for any order, because an order is always placed against a location.
Device states
Every device carries exactly one status:
| Status | What it means |
|---|---|
| Available | Free stock. This is the only status an order can draw from automatically. |
| Allocated | Bound to a customer service. Set by the platform when hardware is assigned, or by hand from the allocation window. |
| Reserved | Held back on purpose. The device is never picked automatically, but you can still allocate it to a service by hand. |
| Maintenance | Taken offline for work. Not sellable. |
| Faulty | Flagged as broken. Not sellable. |
| Decommissioned | Retired but kept on the books. Not sellable. |
Allocated is not offered in the status picker: a device reaches it by being allocated, and leaves it by being deallocated. While a device is allocated its status field is locked and it cannot be deleted.
How a device becomes sellable
Four things have to be true before a machine can fulfil an order automatically:
- Its status is Available.
- It is installed in a rack, so it resolves to a location.
- That location is one the product offers, and it is the location the customer chose at checkout.
- Its specifications satisfy the product's hardware requirements.
The product side of this lives in the product editor's Delivery section: a switch that says the product reserves a server from inventory when it is ordered, an optional restriction to standalone or blade machines, and an optional CPU-model requirement. See Products and Allocation & Equivalences.
How a device is reserved for an order and linked to a service
When an order for such a product is paid, the platform searches the pool of Available devices in the chosen location, picks a matching one, flips it to Allocated and records the service against it. The Service column and the device's own view then show that link. If nothing matches, the service is marked as failed to provision with the reason, and no hardware is touched.
Note: Only products the platform provisions itself — dedicated and bare-metal products with hardware allocation switched on — take a machine out of inventory. Services delivered by a plugin (virtual servers, game servers and anything else a provider manages on your behalf) never get a physical device linked to them, and nothing about them appears on this page.
What happens on suspend and on termination
- Suspend keeps the allocation. The machine's switch ports are brought down and it is powered off, but the device stays Allocated to the service so unsuspending puts it straight back.
- Termination releases the hardware. Ports go down, the machine is powered off, its IP allocations are released, the link to the service is cleared, and any device that was Allocated returns to Available — ready for the next order.
A device sitting in Maintenance or Faulty when the service ends keeps that status; only Allocated is turned back into Available. Termination does not move the device out of its rack.
Reading the page at a glance
Summary tiles
Six tiles run across the top. All six are clickable, and each jumps the table to the matching view:
- Total Devices — every countable device plus blades. Click to return to the All Devices tab with no status filter.
- Available — devices ready to be allocated. Click to filter to available stock.
- Allocated — devices currently bound to a service. Click to filter to allocated devices.
- Maintenance — devices taken offline for work. Click to filter to maintenance.
- Servers — dedicated plus blade servers only. Click to switch the table to a servers-only view.
- Faulty — devices flagged as faulty. Click to filter to faulty.
Note: The tiles count servers, blades, chassis and network devices. Rack furniture — patch panels, cable holders, colocation spaces and PDUs — is deliberately left out of these totals, so the number reflects sellable and manageable equipment. PDUs still get their own tab and count.
Type tabs
Below the tiles, a row of tabs filters the table by device type, each with a live count badge:
- All Devices — every countable device type, blades included.
- Dedicated Servers — standalone rack servers.
- Blade Servers — blades installed in a chassis.
- Chassis — blade enclosures (the type badge also shows installed/total blade bays, e.g. 3/16 blades).
- Network — switches, routers and firewalls combined.
- PDUs — power distribution units, with a Load / Outlets column.
Search and filters
The search box accepts comma-separated terms combined with AND across the columns. Typing Romania, E5-2690, 128, 2TB finds Romania-located machines with an E5-2690 CPU, 128 GB RAM and 2 TB of storage. The search runs by itself a moment after you stop typing, or immediately if you press Enter. Three dropdowns sit alongside it:
| Filter | What it does |
|---|---|
| All Status | Limits the list to one status: Available, Allocated, Reserved, Maintenance, Faulty or Decommissioned. |
| All Locations | Limits the list to one of your locations, listed as country code and name. |
| All CPUs | Limits the list to a single CPU model (for example E5-2690 or EPYC 7543), with the number of machines shown beside each option. |
Changing a tab or any filter returns you to the first page of results.
Table columns
The table adapts to your screen width, so narrower windows hide some columns and collapse the hardware specifications into a single stacked cell. The columns you may see are:
| Column | What it shows |
|---|---|
| Device / Server / Blade Server | The device name, with a shortened CPU model underneath. |
| Type | A colour-coded badge for the device type. For a chassis, the installed/total blade count appears alongside. |
| Location | Country flag, location name and datacenter. |
| Rack | Rack name and U range (for example U10-11). |
| RAM / Storage / NICs | Memory total, storage total and network bandwidth. Hover any of these to see a breakdown of the individual memory modules, drive bays or connected NICs. |
| Load / Outlets | PDUs tab only: the last reported draw and the outlet count. |
| Status | A coloured status indicator with an icon. |
| Service | For an allocated device, the client it is serving, linked to the service record. |
| Serial | The serial number. |
Click a sortable column header to sort by that field. In the collapsed specifications column, the memory, storage and NIC icons let you sort by RAM, storage capacity or NIC count directly — click an icon once for ascending, again for descending. Page-size and paging controls sit at the foot of the table.
Adding devices in bulk
Use the Bulk Add button (top right) to onboard many machines at once. It opens a small menu where you first pick the kind of device you are adding:
- Click Bulk Add and choose Dedicated Servers, Chassis, Network or PDUs.
- The Bulk Add Devices grid opens with ten empty rows. Tabs across the top group the fields. For servers these are Basic Info, Hardware, Asset Tracking, Management and Location. A chassis shows a simpler Chassis Setup and Location; network devices and PDUs show Basic Info, Asset Tracking, Management and Location.
- Fill in at least a name per row. Use Add Row, +5 or +10 to add more rows, Generate Names (on the Basic Info tab) to create sequential names from a prefix and starting number, and the copy icon on a row to mark it as a template, then Apply Template to copy its settings to every row.
- For servers, picking a model fills in the manufacturer and rack height automatically; entering management credentials together with a location lets the grid pull the serial and MAC from the machine with the row's Fetch button. For network devices and PDUs, entering SNMP credentials lets it fetch the model, serial, port count and — for PDUs — outlet and load data.
- Click Add Devices. Any hardware details not yet fetched are collected in the background afterwards; the toast tells you to track that in the Automations dropdown in the header.
Note: A location is required for the automatic fetch to work — management interfaces usually sit on a private network reachable only through that location's local agent. See Local Agents.
Warning: If your licence sets a server allowance, Bulk Add stops when the allowance is reached and tells you how many slots remain. See License.
Refreshing details on existing devices
The Fetch Details button opens the Fetch Device Details dialog (Auto-populate hardware specs from IPMI/SNMP). Rather than scanning one row, you select which device types to refresh — Dedicated Servers, Blade Servers, Chassis, Network Devices or PDUs — and you can pick more than one. The dialog then shows three counters, Total Devices, With Credentials and Missing Credentials, and warns how many will be skipped for lack of a management IP or credentials. Set Concurrent devices (5–100, default 50) to control how many are scanned at once, then click Fetch Details. The scan runs in the background and its progress appears in the Automations dropdown in the header.
Exporting
Click Export (next to the tabs) to download a CSV file. The menu lets you export All Devices, All Servers, or a single type (Dedicated Servers, Blade Servers, Chassis or Network). The export respects your current status, location and CPU filters — but not the text in the search box — and includes name, type, manufacturer, model, serial number, asset tag, status, location, datacenter, rack, rack position, management IP, primary MAC, CPU, RAM, storage, bandwidth and the bound service.
Opening a device
Click any row to open its detail view. The view is read-only until you click Edit; then you can change the status, location, datacenter, rack and U position, manufacturer and model, CPU, memory modules, storage bays, NICs, serial number, asset tag and notes, and click Save. Sections cover IPMI & Credentials, Network Information, SSH Credentials, Asset Information, Memory DIMMs and Storage Bays.
Along the header of the view you get:
- The Allocated to chip when the device backs a service, linking to both the service and the client.
- The live power state (Powered On, Powered Off, Unreachable or Unknown) with a refresh button, and the Power On, Restart and Power Off actions. These stay greyed out until a management IP and BMC credentials are stored.
- Install OS, which appears once BMC credentials are stored — see below.
The footer offers Delete (hidden while the device is allocated, and asking for confirmation inline), a Convert to blade / Convert to dedicated action, and Edit. Use Refresh in the page header at any time to re-pull the table and the summary counts.
Installing an operating system
Click Install OS to open the Install Operating System dialog. It carries a red warning that all data will be lost, then four choices:
- Operating System (required) — picked from the active images in your catalogue. If nothing is offered, the dialog says so and points at Settings → Bare Metal → OS Images. See OS Images.
- Deployment Template (Optional) — leave it on No template (basic install) for a plain install, or pick a saved configuration. See Deployment Templates.
- Boot Method — the server default, network boot, or virtual media through the BMC.
- RAID Configuration (Optional) — no RAID, or RAID 0, 1, 5 or 10 built on the data drives.
Click Install OS to start. The dialog then shows Installation Started with the generated root password — copy it before you close the window. If an install is already running on that machine, the dialog shows its progress and offers to abort it instead.
Note: The Install OS button only appears once the device has a management IP, a BMC username and a stored password. Without those, the action reports that IPMI/BMC credentials are required.
Bulk delete
Tick the checkbox on one or more rows — allocated devices cannot be ticked — and a red action bar appears showing the selection count, with Clear selection and a Delete button. Deletion asks for confirmation first and cannot be undone.
Tips and gotchas
Tip: Reserved versus Available. Set a device to Reserved to hold it for a specific customer or build without exposing it as free stock. Orders only ever draw from Available machines, but you can still allocate a reserved one by hand.
Warning: Allocated means in use. A device with the Allocated status backs a live service. You cannot select or delete it, and you cannot change its status — terminate or reassign the service first.
Tip: Network devices feed other tools. Switches, routers and firewalls recorded under the Network tab are also used by IPAM and Monitoring, so keeping their SNMP credentials current pays off across the platform.
Note: Unracked hardware is invisible to orders. A device with no rack has no location, so it will never be picked. Place it in a rack from Rack Management or by setting its location, datacenter, rack and U position in the device view.
Related articles
Locations · Rack Management · Services · OS Images · IPAM · Monitoring