
Top Header & Global Search
Tour of the admin header bar: global search (⌘K/Ctrl+K), Website, Monitoring, Activity, Settings, Automations, language, notifications and the account switcher.
What the header bar does
The header bar runs across the top of every admin page. It stays fixed while you scroll and bundles the controls you reach for most often: global search on the left, and on the right a link to your public website, quick-jump icons for Monitoring, Activity Log and Settings, an Automations summary, the language switcher, the notification bell and your account menu. Once you know its layout, most admin tasks are one click or one keystroke away.
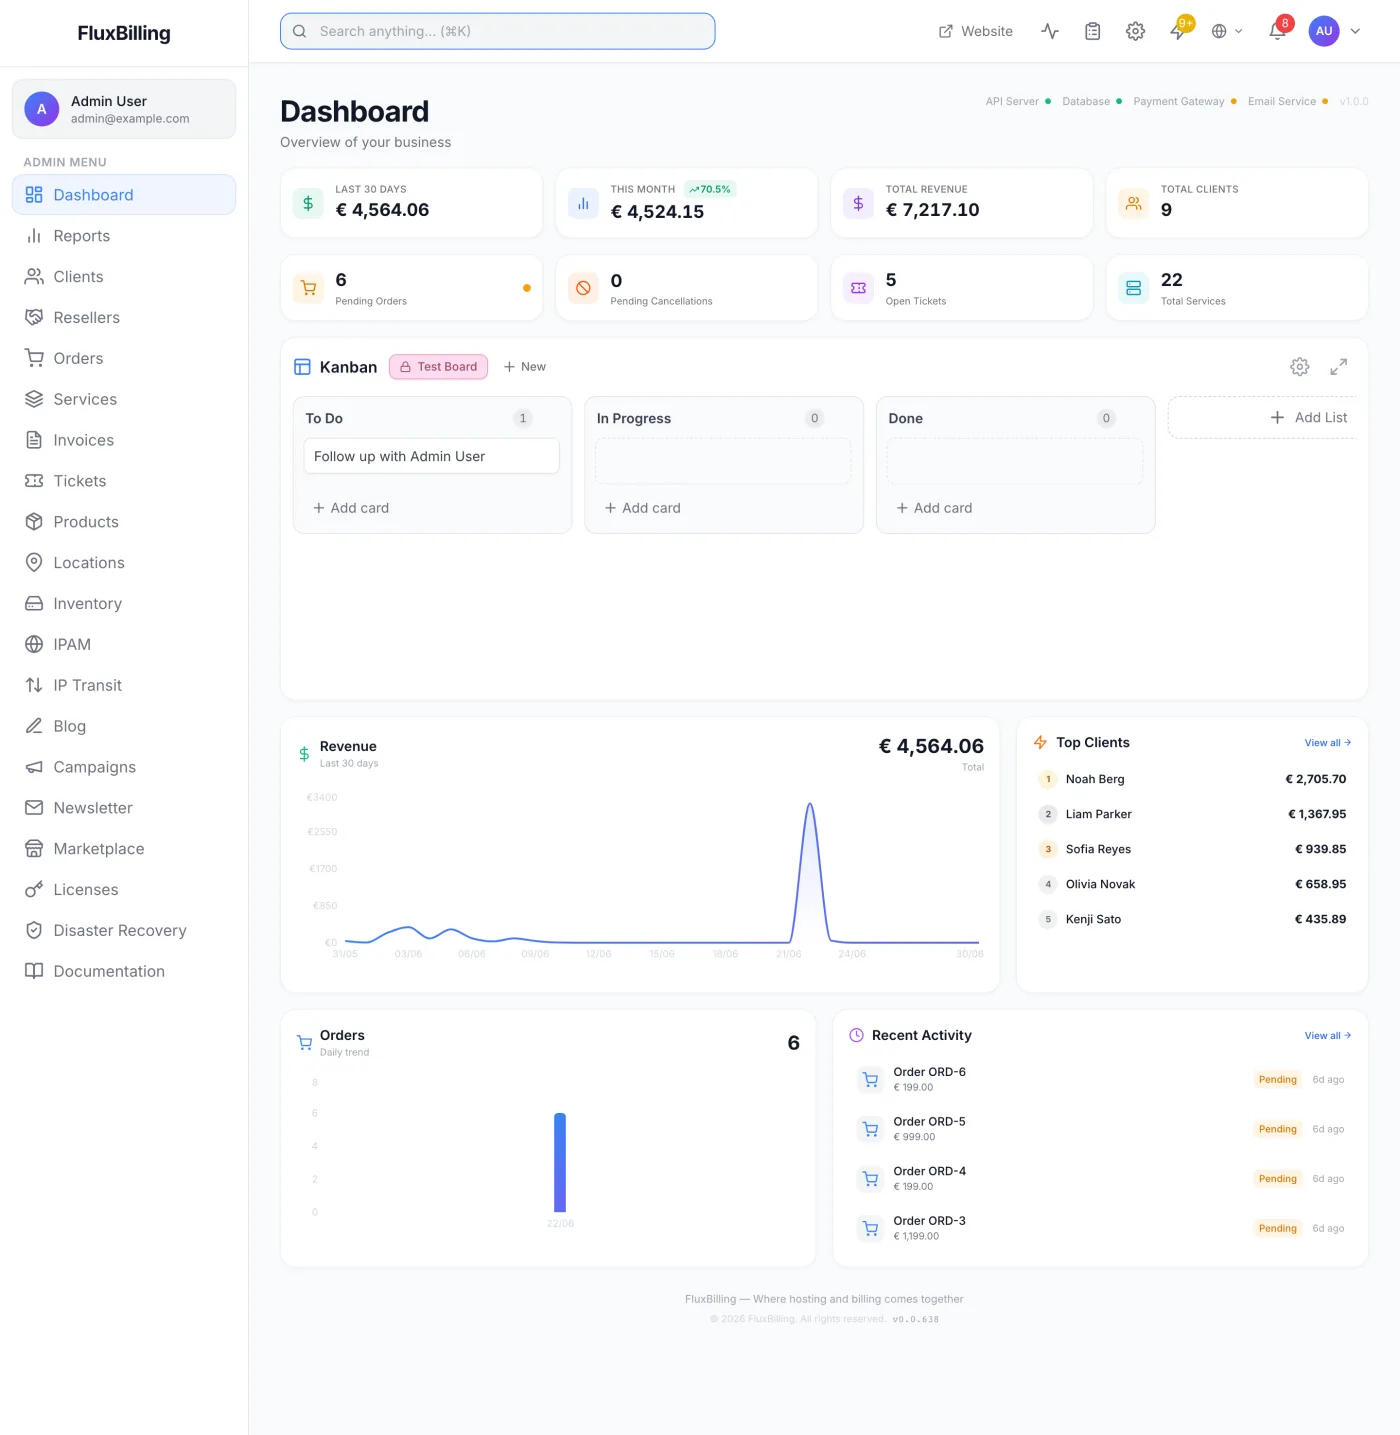
Global search
The search box sits on the left of the header, beside the menu button on smaller screens. It searches across your key records in one pass and groups the matches by type.
Opening and using it
- Click the search box, or press ⌘K (Mac) / Ctrl+K (Windows & Linux) from anywhere in the admin panel. The placeholder reads Search anything... and shows the shortcut for your platform.
- Type at least two characters — a name, an invoice number, a ticket subject, a server name, an IP address, and so on. The search runs a moment after you stop typing, showing Searching... while it works.
- Use the arrow keys to move through the results and press Enter to open the highlighted one, or click any result.
- Press Escape to close the dropdown, or click the small × inside the box to clear what you have typed.
Each result shows a title and a short subtitle, and selecting one takes you straight to that record. Clicking away from the box closes the dropdown without clearing your text.
What global search looks through
Results are grouped under these headings, in this order. Each group returns at most five matches, so a very broad term will not flood the list.
| Group | What it matches |
|---|---|
| Servers | Standalone servers and chassis in your inventory, by name, serial number or management IP. The subtitle shows the serial number and management IP. |
| Blade Servers | Blades, by name, serial number or management IP. |
| Network Devices | Switches, routers and firewalls, by name, serial number or management IP. The subtitle shows the device type and management IP. |
| Active Services | Services with an active status, by service name, hostname or server IP. |
| Inactive Services | The same fields, for every service that is not active. The subtitle is the service's status. |
| Clients | Customer accounts, by email address, first name, last name or full name. The subtitle is the email address, and a sub-contact is labelled with the account owner it belongs to. |
| Orders | Orders, by status or by the number in the order reference. Matches are listed as Order # followed by that number, with the status as the subtitle. |
| Invoices | Invoices, by invoice number. |
| Proformas | Proforma documents, by proforma number. |
| Transactions | Recorded payments, by their transaction reference. The subtitle shows the payment status and the gateway that took it, and selecting one opens the invoice or proforma the payment belongs to. |
| Tickets | Support tickets, by subject or ticket number. |
Tip: global search is the fastest way to open a specific invoice or ticket — type or paste the number and pick the match. If you see No results found, check the spelling or try a shorter, more distinctive term. Remember the search needs at least two characters before it runs, and that it matches the fields listed above and nothing else: a client's phone number or a ticket's message body will not find anything here.
Note: a very broad term across a large installation can take longer than the search is willing to wait, in which case the dropdown simply shows no results. Narrow the term and try again.
The right-hand controls
On the right of the header sits a row of icons and your account menu. Which ones appear depends on your permissions, the modules you have enabled, and your screen width.
| Control | What it does | When it shows |
|---|---|---|
| Website (external-link icon with a label) | Opens your public-facing website. Its address and whether the button appears are set in Settings. | On wider screens, when the website button is set to show for the admin panel |
| Monitoring (activity icon) | Jumps to Monitoring. | When your license includes monitoring, the Monitoring module is on, and you have permission to view it |
| Activity (clipboard icon) | Jumps to the Activity Log. | For super-admins and staff with settings access |
| Settings (gear icon) | Jumps to Settings. | For super-admins and staff with settings access |
| Automations (lightning-bolt icon) | Opens a popover summarising recent automated work. See Automations. | For all admin users |
| Language (globe icon) | Switches the panel language. | Only when more than one language is enabled |
| Notifications (bell icon) | Opens a popover of your recent notifications. See Notifications. | Always |
| Account menu (avatar) | Your profile, account switching and sign-out. | Always |
Automations popover
Click the lightning-bolt icon for a quick read on the automated work the platform has been doing. The popover header carries a (24h) label and coloured pill counts for successful (Ok), Pending and Failed runs over the last 24 hours; the list below shows the most recent runs with a status badge, the action and the integration that handled it, and how long ago each one ran.
- A badge on the icon appears when there is new pending or failed activity since you last opened the popover. It is red when failures are involved and amber otherwise, and it reads
9+above nine. - A failed row carries a retry button so you can re-run it without leaving the popover.
- Clicking a row that belongs to a service opens that service's detail page.
- With nothing to show, it reads No automation tasks yet.
The full walkthrough, including bulk hardware fetches and stuck bare-metal deployments, is in Automations.
Language switcher
Click the globe icon to open the list of languages you have enabled. The current one is ticked; pick another to switch the panel immediately, and your choice is remembered for next time. The globe is hidden entirely when only one language is enabled — add more under Languages & Translations.
Notifications
The bell shows a red badge with your unread count, capped at 9+. Click it for a popover of your most recent notifications — up to ten at a time, each with a title, a short message and a relative timestamp, with unread items tinted. From here you can:
- Click any notification to open the record it refers to; that also marks it read.
- Click Mark all as read in the popover header to clear the unread count.
- Click View all notifications at the bottom to open the full Notifications page.
With none, the popover reads No notifications yet. New notifications that arrive while you are working also appear briefly as a card in the top-right corner of the screen.
Account menu & account switcher
The avatar at the far right opens your account menu. The top of the dropdown repeats your name and email. From here you can:
- Account Settings — opens your Account page to manage your profile, password, second factor and preferences.
- Switch Account — listed only when you have more than one account signed in. Pick another to switch to it instantly. Hover an entry and click the × to drop it from the list.
- Add another account — sign in to an additional account without logging out of the current one. You can keep up to five signed in at once; at the limit the option greys out and shows (max 5).
- Sign out — with a single account signed in this reads Logout and ends your session. With more than one it reads Sign out of all accounts and ends every one of them, then sends you to whatever logout destination is configured in Settings.
Tip: the account switcher is useful if you manage more than one login — a personal staff account and a shared role account, say. Switching clears the panel's cached data, so the account you move to always loads its own up-to-date records rather than showing the previous one's.
The sidebar beside it
The header sits alongside the left sidebar, which is the panel's main navigation. Under an Admin Menu heading it lists, in order: Dashboard, Reports, Clients, Resellers, Orders, Services, Invoices, Tickets, Products, Locations, Inventory, IPAM, IP Transit, VPS, Blog, Campaigns and Newsletter. Rows you have no permission for, and rows whose module is switched off, are simply absent.
VPS is a single row that opens a module with its own tab strip — Overview, Clusters, All VPS, Groups, Game Hosting, Jobs and Settings. Game hosting has no separate sidebar row; it is a tab inside this module. The row stays visible as long as either the VPS Clusters or the game hosting half is available to you.
Above the navigation is your profile card (avatar, name and email), which opens the Account page. It can be hidden platform-wide from Settings. Clicking the logo above it goes to whatever homepage address is configured for the admin panel.
On smaller screens
On narrow screens the sidebar collapses behind a menu button at the far left of the header, and the header keeps only the search box, the notification bell and your account avatar. The Website, Monitoring, Activity, Settings, Automations and Language controls move into an overflow three-dot menu so nothing is lost — tap it to reach the same actions in a list, with the Automations badge shown against its row.
Related
Dashboard · Account · Notifications · Automations · Activity Log · Settings · Languages & Translations