
IP Transit
Manage customer IP transit services in FluxBilling: review BGP sessions, assign switch ports, track P95 traffic, and bill committed-rate overages.
What the IP Transit page is for
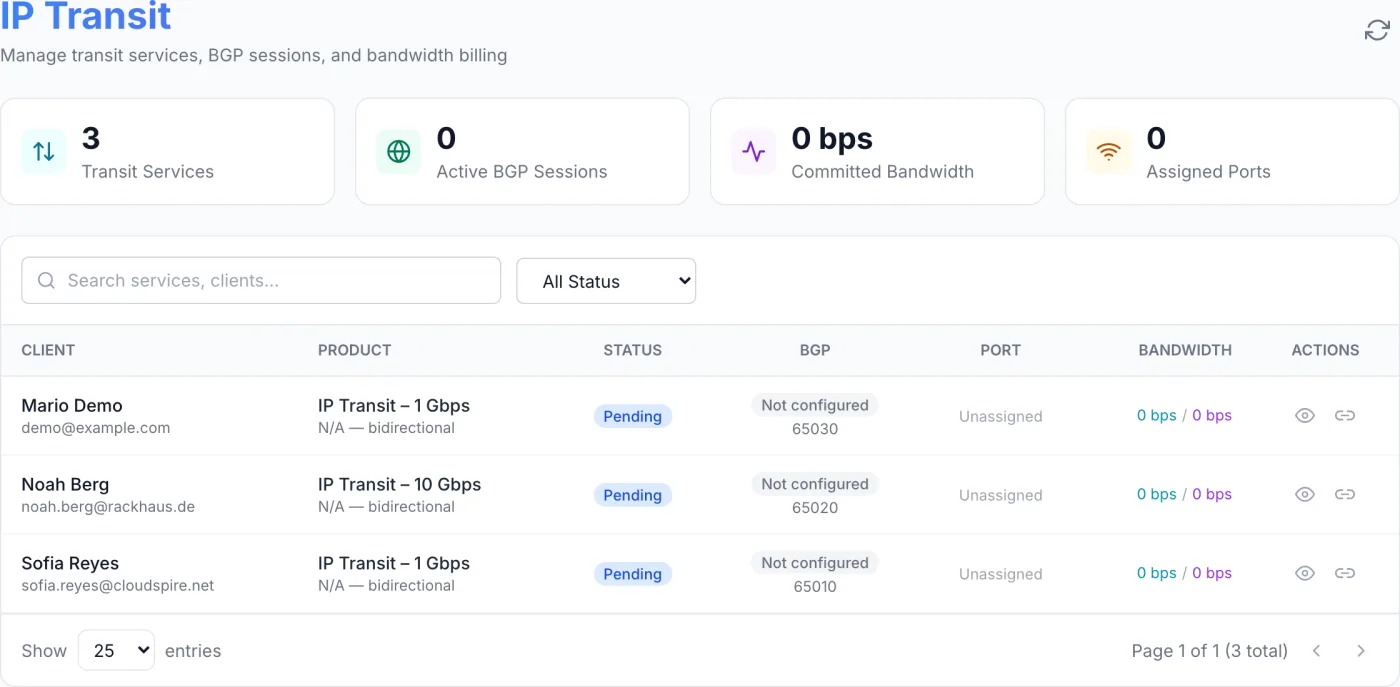
The IP Transit page is the roster of the bandwidth services you sell. Its subtitle reads Manage transit services, BGP sessions, and bandwidth billing. Each row is one customer transit service and brings together its session state, its switch-port assignment, its committed rate, and its measured traffic. From here you review the estate, link a service to a physical port, and open a service to work on it in detail.
How to reach it
Open the admin sidebar and click IP Transit (the up-and-down arrows icon). The item appears when the IP Transit module is enabled for your company and your role has permission to view it. Services appear here on their own once a customer orders a product in the IP Transit category.
Reading the page
Summary tiles
| Tile | What it counts |
|---|---|
| Transit Services | Total number of transit services, across all statuses. |
| Active BGP Sessions | How many sessions are currently recorded as active. |
| Committed Bandwidth | The summed committed rate of all services, shown in Mbps or Gbps depending on size. |
| Assigned Ports | How many services are linked to a physical switch port. |
Search and filter
Use the Search services, clients… box to find a service by client or product, and the status dropdown to narrow the list. It offers All Status, Active, Suspended, Pending, and Terminated. Two icons sit in the top-right of the header: a gear that opens Transit Billing Settings, and a circular arrow that reloads the tiles and the table.
Table columns
The Client, Product, and Status headers are sortable.
| Column | Shows |
|---|---|
| Client | Customer name and email. Click the name to jump to the client's profile. |
| Product | The product name, with its port speed and billing direction underneath (bidirectional when the product does not say). |
| Status | A coloured pill: Active (green), Suspended (red), Pending (amber), Terminated (grey). |
| BGP | A coloured pill for the recorded session state — Not configured (grey), Configured (blue), Active (green), Down (red), or Idle (amber). The customer ASN appears below the pill once it is set. |
| Port | The switch name and port if one is assigned, otherwise Unassigned. |
| Bandwidth | Current inbound / outbound rate (cyan for in, purple for out). When the product has a committed rate, a badge underneath reads N% of CDR, using the busier of the two directions — green below 70%, amber from 70%, red from 95%. |
| Actions | A view-details (eye) button, and either an assign-port or unassign-port button depending on whether a port is linked. |
With no services the table reads No transit services found. The pagination bar at the bottom lets you show 25, 50, or 100 entries and step through pages.
Opening a service
Click the eye icon, or anywhere on the row, to open that service's own page. There is no pop-up dialog — everything about a transit service lives on its Service Details page, alongside the ordinary billing and lifecycle controls that every service has. Four extra cards appear there for a transit service, described below. Use the page's Edit button to make the editable fields live, and Save Changes to store them.
BGP Configuration
This card is your record of the session you configure on your own router. Outside edit mode it displays Customer ASN, Peer IPv4, Customer IPv4, Peer IPv6, Customer IPv6, Route Type, Prefix Limit, and IRR / AS-SET, with a state badge next to the heading. In edit mode you can set:
| Field | What it does |
|---|---|
| Customer ASN | The customer's autonomous system number, for example AS65001. |
| BGP Status | The session state you are recording: Not Configured, Configured, Active, Down, or Idle. This drives the pill in the table and the Active BGP Sessions tile. |
| Peer IPv4 / Peer IPv6 | Your side's peering addresses. |
| Customer IPv4 / Customer IPv6 | The customer's peering addresses. |
| Route Type | What you advertise to this customer: Full Table, Default Route Only, Partial Table, or Custom Communities. |
| Prefix Limit | Maximum number of prefixes accepted from the customer. New services start at 100. |
| IRR / AS-SET | The customer's routing-registry AS-SET, for example AS-EXAMPLE. |
| MD5 Password | Optional session authentication password, entered masked. Shown in edit mode only. |
| BGP Communities | Comma-separated community strings, for example 65001:100, 65001:200. Shown in edit mode only. |
Note: saving these values does not push configuration to network hardware. Set BGP Status to Active only once the session is genuinely established, because the dashboard tile counts it.
Where each setting lives — product or service
Route Type and Prefix Limit belong to the individual service, on the card above, and nowhere else. They are per-session facts, so a single value on the product could not describe a customer whose session differs. The product now carries only what is genuinely the same for every buyer of that plan. Nothing on the product sets a route type, a prefix limit, or a service-level guarantee — put an availability commitment in the product description or the contract, which the customer actually sees.
| Section | Fields |
|---|---|
| Port & Capacity | Port Speed (preset chips plus a free-text box), Bandwidth, Committed Rate, Burst Rate, and — only for transfer billing — Included Transfer (GB). |
| Billing | Billing Model (Flat Rate, 95th Percentile, Committed + Burst (95th), Transfer (per GB/TB)), Billing Direction (Bidirectional, Inbound Only, Outbound Only), Overage Rate per Mbps for the rate-based models, and Overage Rate per GB for transfer billing. |
| BGP & Routing | Provider ASN (your own ASN, shown to clients) and BGP Sessions (how many the plan includes). |
| Included | Included Subnets and Included VLANs. |
A separate Overage Pricing panel on the product lets you switch between Simple and Tiered. Tiered pricing replaces the flat overage rate with a table of Up to (Mbps) and Rate per Mbps rows; leave the last row's Up to empty for an unlimited final tier. See Products.
Port & Bandwidth
This card shows four tiles — Port Speed and Committed Rate from the product, and Current In and Current Out from the latest measurement. When a port is assigned, a line underneath names the switch, the port, and the VLAN if one was given. The heading carries an Assign Port or Unassign Port link.
Below the tiles is the traffic graph: inbound and outbound rates with P95, Max, and Avg figures above it, and 6H / 24H / 7D / 30D buttons to change the window (24H by default). A dashed line marks the committed rate so you can see at a glance when traffic runs over the commitment. Before any samples exist the chart reads No traffic data available for this period.
Billing Periods (95th Percentile)
| Column | Meaning |
|---|---|
| Period | The period start date, with the billing model when it is not 95th percentile. |
| P95 In / P95 Out | 95th-percentile inbound and outbound rates for the period. |
| Billable P95 | The figure actually billed, or the transferred volume for transfer billing. |
| Overage | The charge above the commitment, in the service's currency. |
| Samples | How many measurements went into the calculation. |
| Invoice | A View link to the generated document, Pending while an overage is waiting to be billed, or a dash. |
Before the first calculation runs the table reads No billing periods calculated yet.
Allocated IPs & Subnets
The last card is the addressing attached to this transit service. It appears whenever addressing is not switched off for your company. Click Add Allocation and fill in:
- Type — Single IP or Subnet.
- Purpose — transit, customer wan, point to point, loopback, or other.
- VLAN — only VLANs at the service's location are offered.
- Subnet — the available blocks inside that VLAN.
- For a single address, IP Assignment: Auto (next available) or Specific IP. The panel tells you how many addresses are free in the block.
- Optional Notes, then Allocate.
Each row carries a Release action; confirming it returns the address or block to the available pool. Blocks you intend to sell as transit space can be tagged with the IP Transit role in IPAM, which stops them being handed to a dedicated server by mistake.
Assigning a switch port
Linking a service to a physical port lets the platform sample traffic on a real interface.
- On an unassigned row click the Assign Port (link) button, or use the link on the service's Port & Bandwidth card. The Assign Switch Port window opens.
- Pick a device from the Switch dropdown, which lists your network devices by name and management address.
- Choose a port from the Port dropdown. Only ports not already connected to a server, blade, or service are offered, each labelled with its speed and up/down state. If a switch has none free you see No unassigned ports available on this switch.
- Optionally enter a VLAN ID (optional).
- Click Assign Port.
Tip: to move a service to a different port, unassign it first — the window only offers ports that are currently free.
Unassigning a port
Click the Unassign Port (plug) button on an assigned row, or the link on the service's Port & Bandwidth card. You are asked Unassign this switch port from the transit service? Confirming removes the association and frees the port for reuse.
Transit Billing Settings
The gear icon in the page header opens Transit Billing Settings. These apply to every transit service in your company and are the fallback for anything a product does not define.
| Setting | What it does |
|---|---|
| 95th Percentile / Usage Billing | Calculate monthly usage (95th percentile or transfer overage) for all IP Transit services. When off, no usage is calculated or billed. On by default. |
| Auto-Invoice Overage | Automatically generate an invoice or proforma (follows your billing document type) for calculated overage. On by default, and only available while usage billing is on. |
| Default Billing Direction | Higher of in/out (industry standard), Inbound only, Outbound only, or Sum of in + out. Used when the product or service does not define its own direction. |
| Default Overage Rate (per Mbps) | Fallback rate when the product has no overage rate or tiers configured. |
| Client Self-Service Editing | Lets clients edit their own session details from the client portal. With it on, tick which of Customer ASN, IRR AS-SET, Announced prefixes, and Route type they may change. |
| Provider ASN | Shown to clients as the peer ASN when the product does not define one. |
Click Save Settings to store them.
How usage billing runs
Traffic on an assigned port is sampled every five minutes. Once a month, on the daily billing pass, the platform closes the previous calendar month for every active transit service whose product uses 95th Percentile, Committed + Burst (95th), or Transfer billing, and writes the billing period you see on the service. Services on Flat Rate are not metered. A period that has already been calculated is never recalculated, so a service activated mid-run is simply picked up on the next pass.
Where the measured figure exceeds the commitment and Auto-Invoice Overage is on, the platform raises a document for the difference — an invoice or a proforma, following the billing document type your company uses. Reseller-owned transit services are charged overage at their wholesale rate.
Note: transit usage billing is separate from the service's ordinary renewal cycle. A transit service can therefore produce a usage charge on top of its recurring commitment.
What the customer sees
On their own service page a transit customer sees their assigned addresses, a BGP session card (your ASN, their ASN, the peering addresses, route type, prefix limit, IRR AS-SET, and announced prefixes), a traffic chart with their percentage of the committed rate, and a port panel showing port speed, committed rate, burst rate, and location. When Client Self-Service Editing is on, a pencil on the session card lets them change only the fields you ticked.
Tips and notes
- The Committed Bandwidth tile and the line on the traffic graph both come from the committed rate on the product, so set that carefully — see Products.
- Traffic graphs and billing periods only fill in once the service has a port assigned and samples have been collected. Assign the port early.
- The port dropdown only lists genuinely free ports, so keep your switch port records current in Inventory.
- The BGP pill reflects the value you set by hand. It is your operational record, not a live reading from a router.
Related
Service Details · IPAM · Products · Inventory · Services