
Monitoring
Monitor network and server hardware health with SNMP polling: Overview KPIs, a device table, alerts with bulk actions, and a topology map.
What the Monitoring page is for
The Monitoring page is a live health overview of the network hardware you have recorded in Inventory. Its subtitle reads Network and server monitoring. Every device with polling switched on and a management address is queried on a fixed cycle, and the results — reachability, port traffic, CPU, memory, temperature, and open alerts — are gathered here. Use it to spot an overloaded switch, an unreachable router, or a temperature climbing before it becomes an outage.
How to open it, and when it appears
Monitoring lives in the top header bar of the admin panel, not in the left sidebar. On wider screens it is an activity icon near the settings and activity icons in the top-right corner; hover it and the tooltip reads Monitoring. On narrow screens, open the three-dot More menu in the top-right and choose Monitoring. Either route opens the page on the Overview tab.
Three things have to line up for the icon to be there at all:
- Your plan has to include monitoring. It is an entitlement, so a plan that does not cover it hides the page entirely, whatever your settings say.
- The Monitoring module has to be enabled for your company under Settings → General → Features.
- Your role needs permission to view monitoring.
If the icon is missing and the module is on, ask whoever manages your subscription whether monitoring is part of your plan.
Once on the page, a Refresh button sits in the top-right. It re-pulls the overview tiles, the device table, and the alert list, and shows a brief Refreshing monitoring data... confirmation.
What actually gets polled
Only network hardware is polled: switches, routers, firewalls, PDUs, access points, and load balancers. Each one must have a management IP and polling switched on in Inventory. Devices recorded without those still appear in the list, carrying a grey No SNMP badge and no measurements.
The cycle is fixed: every device is polled every five minutes, samples are rolled up into hourly figures a few minutes past each hour, and old data is trimmed once a day. Raw five-minute samples and device health readings are kept for seven days; the hourly rollups and closed alerts are kept for ninety.
Tip: rates are worked out as the difference from the previous poll, so a device only produces meaningful traffic figures from its second successful poll onwards.
The four tabs
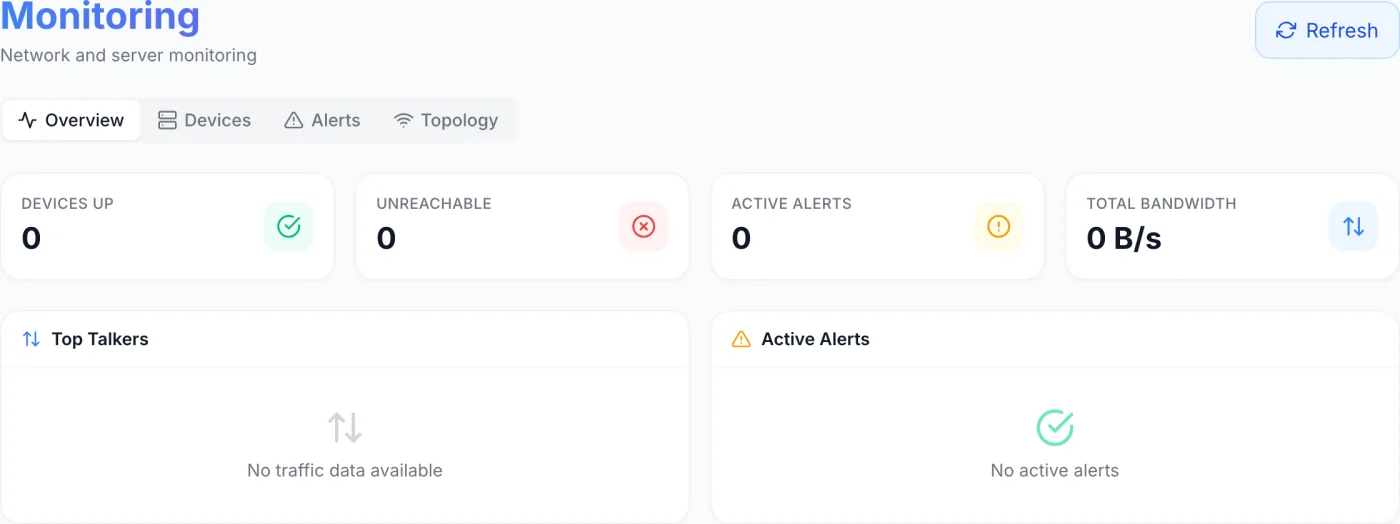
A tab strip sits below the page heading. When alerts are open, a red count badge appears on the Alerts tab.
- Overview — summary tiles plus the Top Talkers and Active Alerts panels.
- Devices — a searchable, filterable table of every network device.
- Alerts — the full alert list with filters and bulk actions.
- Topology — a map of your devices and the links between them.
Overview tab
| Tile | What it shows |
|---|---|
| Devices Up | Count of monitored devices whose last poll was recent. |
| Unreachable | Count of monitored devices the platform currently cannot reach. |
| Active Alerts | Total number of open alerts. |
| Total Bandwidth | Combined inbound and outbound throughput across every polled port at the latest poll, shown in bytes per second (B/s, KB/s, MB/s, GB/s). |
Below the tiles sit two panels:
- Top Talkers — the eight busiest ports, ranked, each showing the device name, the port name, and the inbound (green ↓) and outbound (blue ↑) rates. Click a row to open that device. With no data the panel reads No traffic data available.
- Active Alerts — the most recent open alerts with a severity badge, the device name, and a timestamp. Click a row to jump to the device. When all is well you get a green tick and No active alerts.
Devices tab
Three controls narrow the list:
| Control | Purpose |
|---|---|
| Search devices… | Type to filter by name. Click the × to clear. |
| Status filter | All Status, Monitored, or Not Monitored. |
| Type filter | Switch, Router, Firewall, PDU, Access Point, or Load Balancer. |
| Column | Meaning |
|---|---|
| Status | A coloured dot with a word — green Up or amber Warning — or a red SNMP Unreachable badge when polling has stalled. Devices without polling configured show a grey No SNMP badge. |
| Name | The device name from Inventory. |
| IP | The management address being polled. |
| Type | Switch, router, firewall, and so on. |
| Ports | Ports up out of total ports. |
| CPU | Current processor use. Amber above 70%, red above 90%. |
| Temp | Temperature in °C. Amber above 65°C, red above 80°C. |
| Utilization | Average inbound link utilisation as a small bar. Amber above 50%, red above 80%. |
| Alerts | A badge with the count of open alerts for that device — red if any is critical, amber otherwise. |
| Uptime | How long the device reports having been up, in days and hours. |
Click any row to open its detail page — see Monitoring Device. With nothing recorded yet the table reads No network devices and points you at Inventory.
Note: the narrower the window, the more columns are dropped to keep the table readable — IP, Type, Ports, Temp, Utilization and Uptime go first and come back as the window widens. Use the search box rather than scrolling on a long list.
Alerts tab
This is the full alert list. Two dropdowns filter it: Severity (Critical, Warning, Info) and Status (Active, Acknowledged, Resolved).
Columns are a select checkbox, Severity, Device, Type, Message, Time, Status, and Actions. Per-row buttons:
- Acknowledge — marks an alert as seen without clearing the underlying condition. The status badge becomes Acknowledged. Offered only on an active alert that has not been acknowledged.
- Resolve — closes the alert; the badge becomes Resolved. Offered on any active alert.
To act on many at once, tick one or more rows, or the header checkbox to select the whole page. A blue toolbar appears showing how many are selected, with two groups of buttons:
| Button | Effect |
|---|---|
| Acknowledge Selected / Resolve Selected / Delete Selected | Applies only to the rows you ticked. |
| Acknowledge All / Resolve All / Delete All | Applies to every alert matching the current Severity and Status filters, not just the page in front of you. |
The list shows 25 alerts at a time; when there are more, Previous and Next appear at the bottom with a Showing X of Y count. With nothing matching, the table reads No alerts found — All clear, no alerts match the current filters.
Warning: Delete removes alerts from the history permanently — it does not clear a live condition. To close an alert but keep the record, use Resolve. The All buttons follow your current filters, so set Severity and Status first.
Topology tab
The Topology tab draws your monitored network devices on a map, grouped by location and data centre, with lines for the discovered links between them. A view selector focuses the map on a region — World, Europe (the default), Europe & Americas, North America, Asia Pacific, Middle East, or Africa. A summary line next to it counts the locations, data centres, devices, links, and total traffic in view, and a legend explains the node colours: Up (green), Warn (amber), Down (red), N/A (grey).
The selector, summary and legend only appear once there is at least one device on the map.
Reading device status
Reachability is judged purely from how long ago the last successful poll was:
- Up (green) — polled within roughly the last 10 minutes.
- Warning (amber) — the last poll was around 10 to 15 minutes ago.
- SNMP Unreachable (red) — no successful poll for more than about 15 minutes, or none ever.
When a device sits in SNMP Unreachable, the usual causes are a wrong management address or wrong polling credentials. Open the device in Inventory, check those values, and use Test SNMP there to confirm before coming back.
Alerting
Alerts are evaluated after each polling cycle, against the warning and critical limits you set. Limits are set per device, from the Thresholds button on the device's own page — see Monitoring Device. Until at least one limit exists, no alerts are raised, so setting thresholds on your important devices is the step that switches alerting on.
The conditions the platform can raise are: port down, high inbound or outbound utilisation, high error rate, high discard rate, device unreachable, high CPU, high memory, high temperature, fan failure, and power-supply failure. An alert is raised once and stays open until the condition clears, at which point it is resolved automatically.
When an alert is raised it is also announced:
- An in-app notification for administrators, linking straight to the device.
- A platform event that any messaging plugin you have installed can act on — see Notification Plugins.
- An email to your admin and staff users, for warning and critical severities only.
Resolving an alert sends a matching all-clear.
Tips
- Total Bandwidth is the sum across every polled port at the latest cycle, so it reflects current throughput rather than a long-term average.
- After fixing a device's polling settings, use Poll Now on that device's page for an immediate re-read rather than waiting for the next cycle. The page-level Refresh only re-reads what is already stored.
- The All bulk actions on the Alerts tab respect your current filters — set them before you click.
- A device that reads Warning is usually a slow or partially failing poll rather than a hardware problem; check it again after the next cycle before chasing it.
Related
Monitoring Device · Inventory · DDoS Protection · Notifications · Activity Log