
Network Devices: SNMP, Ports and Switch Drivers
Set up switches, routers and firewalls: SNMP, port discovery, cabling records, port-down alerting, traffic graphs and switch automation drivers.
Every switch, router and firewall you record in Inventory has its own device window. From it you store the device's management address and credentials, connect over SNMP, discover its ports, record which server or device each port is cabled to, decide which ports may raise a port-down alert, follow traffic per port, and, for switches, choose the automation driver FluxBilling uses when it configures a server's switch port.
This article walks through that window from top to bottom. Adding devices in bulk, the Inventory table and the rack view have their own articles: Inventory and Rack Management.
Before you start
- The Inventory module must be on. It is the Inventory switch among the feature toggles in Settings → General (see Modules and feature toggles).
- Staff need an Inventory permission: View Inventory or Edit Inventory (see Staff and permissions).
- Showing or copying stored secrets (the SSH password and the SNMP community string or passwords) is limited to super admins. Other staff see the secret masked and cannot reveal it.
- The SSH terminal is open to administrators only. Staff accounts are refused.
- IPAM changes two things in this window: with IPAM on, the switch's address is picked from your subnets, and the switch automation fields (driver, SSH username, SSH port, enable password and eAPI URL) can be set and saved. Without IPAM, changes to these fields are not saved. See IPAM.
- Network access. FluxBilling must reach the device's management address over SNMP (and SSH for the terminal and for drivers that use SSH). If your management network is private, install a local agent in that location so the traffic goes through it.
Adding a network device
- Open Inventory from the sidebar.
- Click Bulk Add and choose Network.
- For each row, pick the type (Switch, Router or Firewall) and fill in the model, the management address and the SNMP credentials. With credentials filled in, the row can fetch the model, serial number and port list from the device before you save.
The type matters later: only switches get the SSH username, SSH port and automation driver fields, because only switches are configured by switch automation. The full Bulk Add walkthrough is in Inventory.
Opening the device window
You can open the same window from four places:
- Inventory, Network tab: click the device's row.
- Rack Management: click a switch, router or firewall in the rack diagram.
- Monitoring, on a device's monitoring page: click View Device (see Device monitoring).
- A server's details window: click the switch listed against one of its network interfaces.
What the window shows
Header and action bar
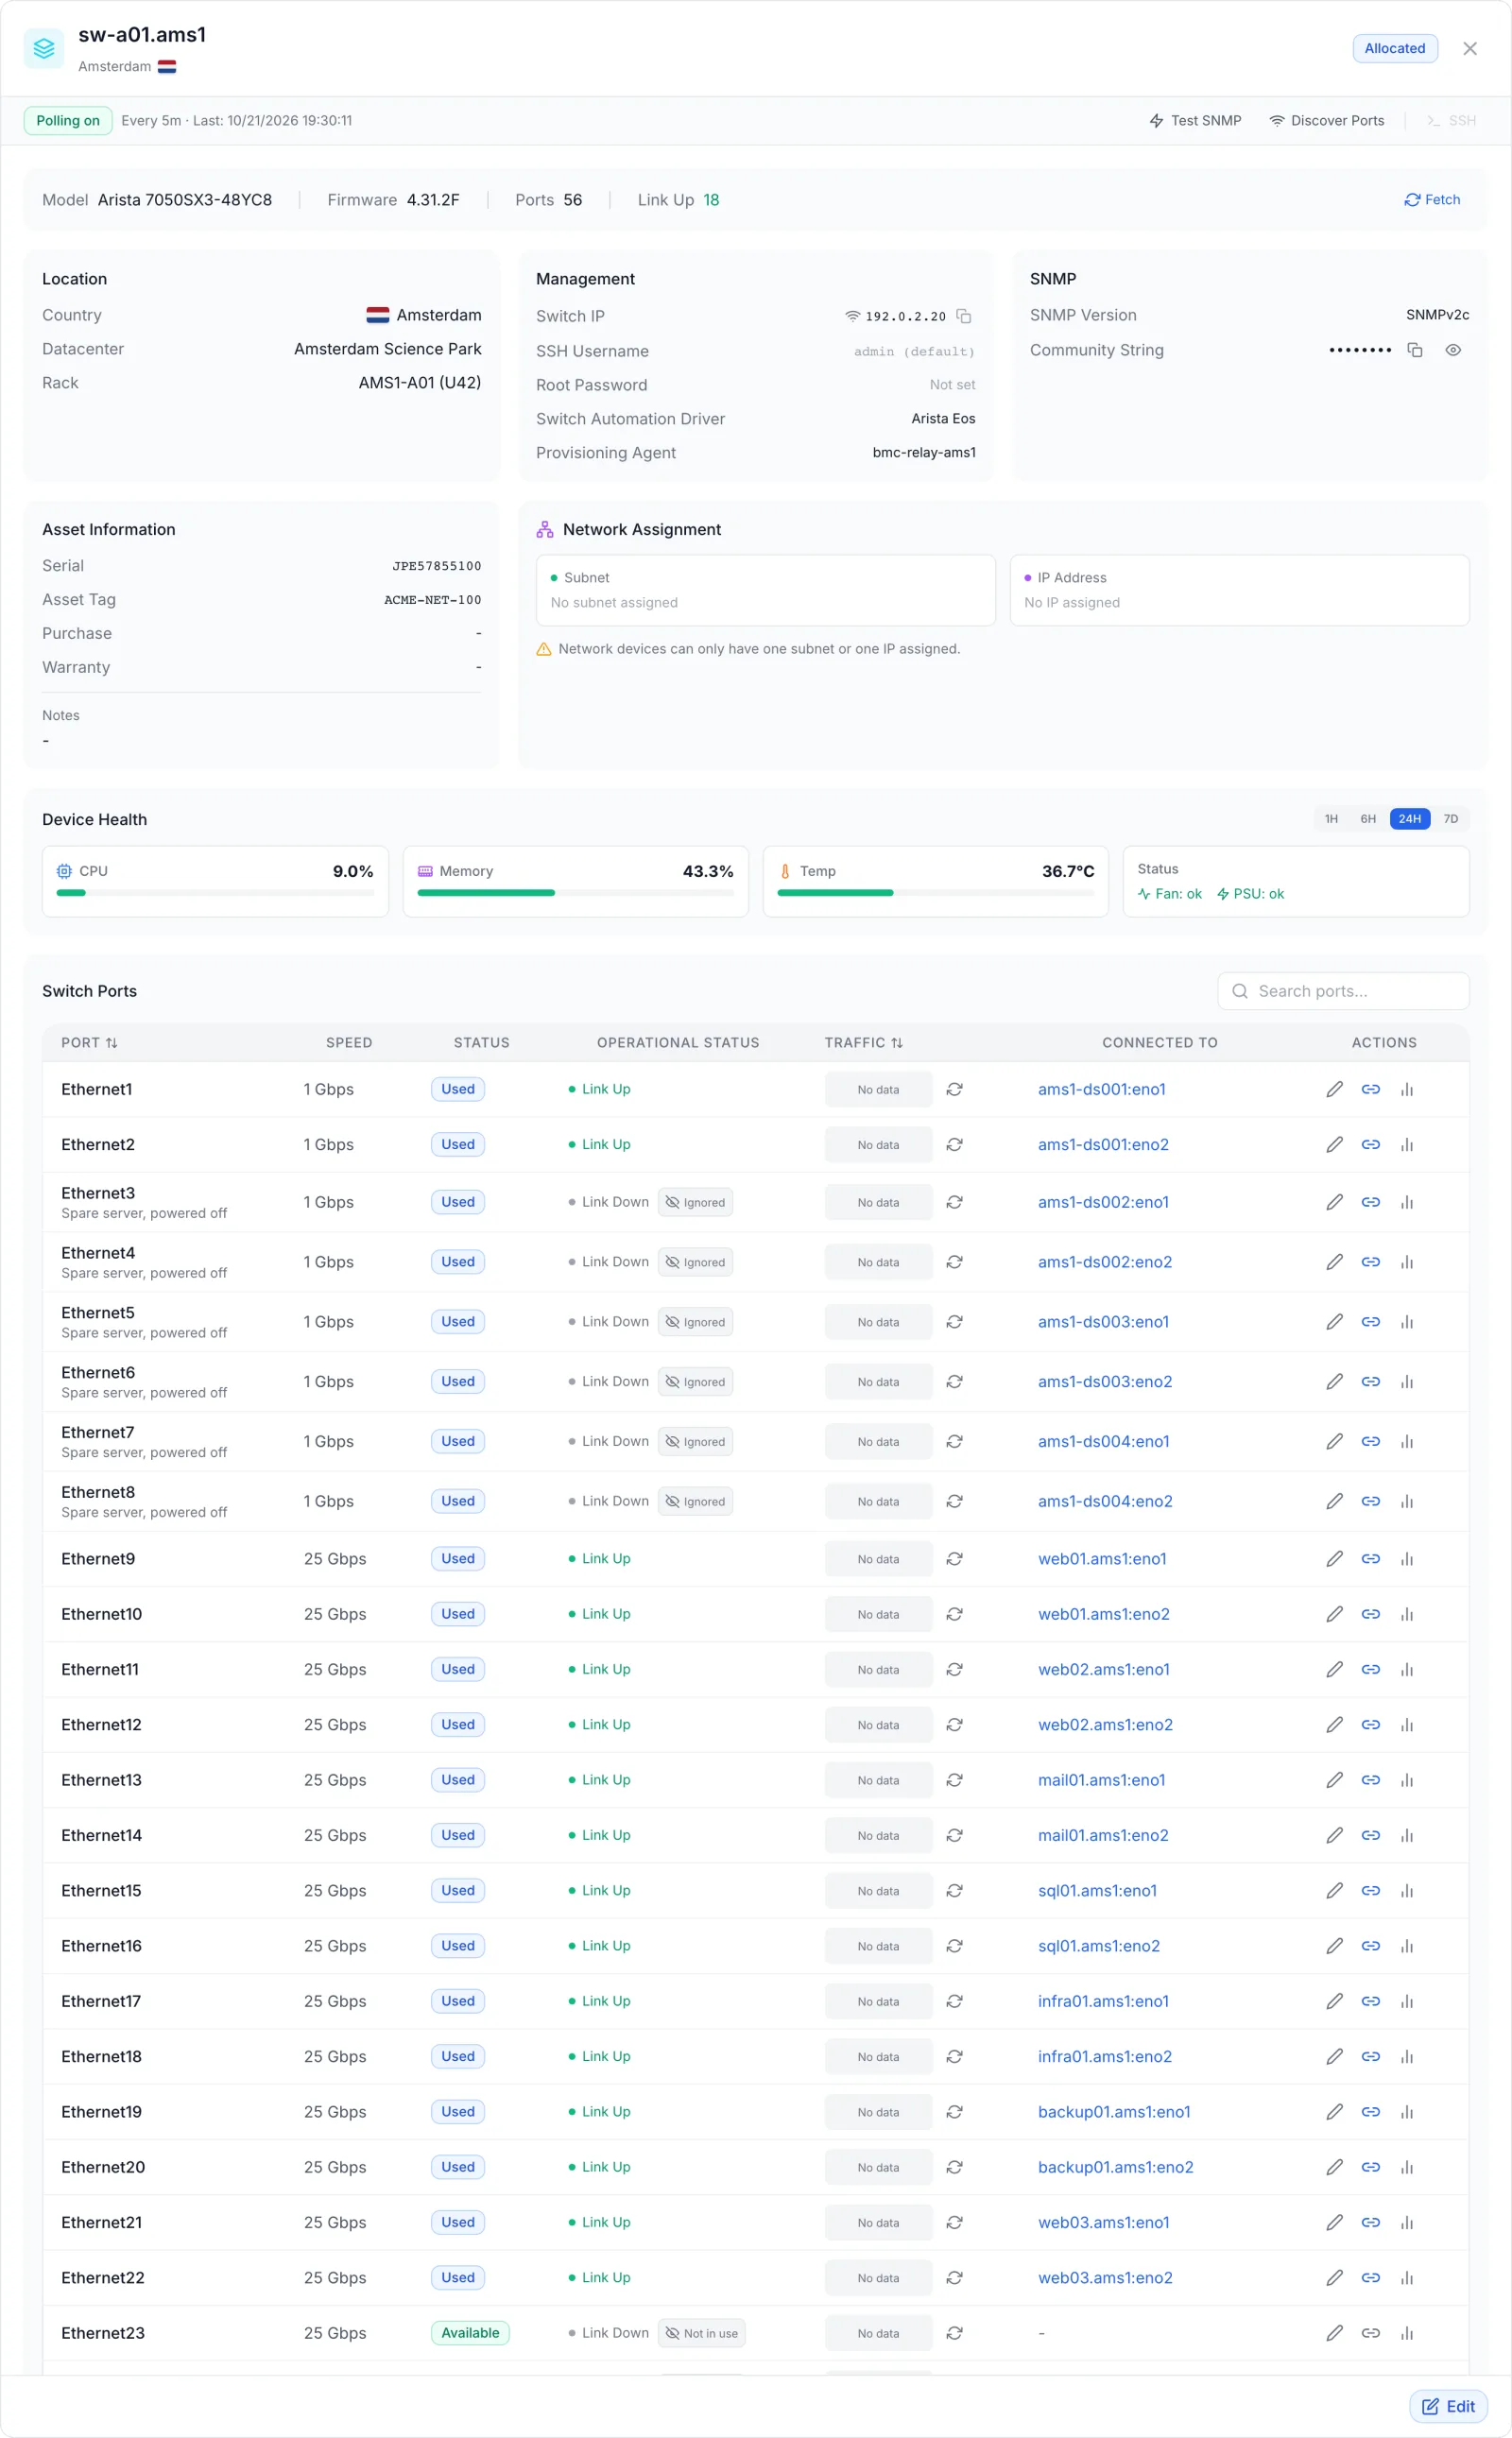
The header shows the device name, its location with the country flag, and its status badge. Under it, the action bar shows Polling on or Polling off, with the time of the last poll when polling is on, and three buttons:
- Test SNMP: reads the device's identity with the stored SNMP credentials. On success you see SNMP OK — followed by the device's system name and model.
- Discover Ports: polls the device right away and refreshes the port list, the traffic graphs and the health figures.
- SSH: opens a terminal to the device's management address in the browser. It is greyed out until the device has a management address and an SSH password. Hover it to see which one is missing.
The three buttons are disabled while you are editing the device.
Summary strip
Under the action bar: Model (manufacturer and model), Firmware, Ports (how many ports are known) and Link Up (how many of them have link). When the device has a management address and SNMP credentials, a Fetch button reads the model and firmware over SNMP and saves them straight away. The confirmation reads Model and firmware fetched.
Cards
- Location: Country, Datacenter and Rack, with the rack unit in brackets.
- Management: the switch address, credentials, the automation driver (switches only) and the Provisioning Agent. With no agent chosen it reads Auto (by location).
- SNMP: the SNMP version and its credentials. Secrets are masked; super admins can reveal them with the eye icon or copy them with the copy icon.
- Asset Information: Serial, Asset Tag, Purchase, Warranty and Notes.
- Network Assignment: the subnet or IP address assigned to the device in IPAM. A network device holds either one subnet or one IP address, never both; the card says so: Network devices can only have one subnet or one IP assigned. Hover an assignment and click the bin icon to deallocate the subnet or release the IP.
- Device Health: shown only when polling is on (see Device health).
- Switch Ports: the port table (see The port table).
While the window is open, the port list, the small traffic graphs and the port connections refresh every 30 seconds.
Editing the device
Click Edit at the bottom right. The cards turn into fields in place. Click Save to store everything at once, or Cancel to leave without changes. A successful save shows Device updated successfully.
| Field | Card | What it does |
|---|---|---|
| Label | Summary strip | The device name shown everywhere in the panel. |
| Model | Summary strip | Type a model or pick one from your saved device models. The refresh icon next to it reads the model over SNMP and, for a switch with no driver yet, also fills in the suggested automation driver. |
| Status | Summary strip | Available, In Use, Allocated, Reserved, Maintenance, Faulty or Decommissioned. |
| Country, Datacenter, Rack | Location | Each list narrows the next one. The small U box next to the rack is the rack unit the device starts at. |
| Switch IP | Management | The management address. With IPAM on, choose IPAM to pick a free address from a management subnet in the device's location (or Auto — next available), or Manual to type one. With IPAM off it is a plain field. |
| SSH Username | Management | Switches only. The user for the SSH terminal and for drivers that log in over SSH. Left empty, the switch uses admin, shown as admin (default). Routers and firewalls always connect as root. |
| Root Password | Management | The SSH password. Leave the field as it opened to keep the stored one. |
| SSH Port | Management | Switches only. Port 22 unless you change it. Routers and firewalls always use 22. |
| Enable password | Management | Switches with the Cisco Ios driver only. Needed when the SSH user has to run enable; skip it if the user has privilege 15. A stored value shows as (configured). |
| Switch Automation Driver | Management | Switches only. See Switch automation drivers. |
| eAPI URL | Management | Switches with the Arista Eos driver. Optional; left empty, the driver uses SSH instead. |
| Provisioning Agent | Management | The local agent that carries SNMP and SSH traffic to this device. Auto (resolve by location) uses an online agent assigned to the device's location. A chosen agent must be online for polling and switch changes to reach the device. |
| SNMP Version | SNMP | SNMPv2c or SNMPv3. |
| Community String | SNMP | SNMPv2c only. A stored value shows as (configured); leave it as it is to keep it. |
| Username, Auth Protocol, Auth Password, Privacy Protocol, Privacy Password | SNMP | SNMPv3 only. Auth Protocol is SHA or MD5; Privacy Protocol is AES or DES. SNMPv3 needs a username and an auth password to connect. |
| Auto Polling | SNMP | Includes the device in scheduled polling, which collects port traffic, link state and health figures and feeds Monitoring. |
| Serial, Asset Tag, Purchase, Warranty, Notes | Asset Information | Your own records. Purchase and Warranty are dates. |
Secrets are kept unless you change them. Save only replaces a secret whose field you changed. When a super admin opens edit mode, the stored passwords and community string are filled in: leave them as they are to keep them, and note that clearing a filled-in field removes the stored secret. Other staff see these fields empty and can leave them empty to keep the stored values.
Connecting over SNMP, step by step
- On the device, allow SNMP read access from FluxBilling (or from the local agent in that location) and note the community string, or the SNMPv3 user and passwords.
- In the device window, click Edit. Set Switch IP, choose the SNMP Version and enter the credentials.
- If the device is on a private management network, pick its Provisioning Agent or leave it on Auto (resolve by location).
- Turn on Auto Polling if you want traffic history, health figures and port-down alerts.
- Click Save.
- Click Test SNMP. You should see SNMP OK — with the device's name.
- Click Discover Ports. The first run records a baseline and says Baseline recorded. Click Discover Ports again in ~60s to see traffic rates. Traffic rates are calculated from the difference between two polls, so click it again after a minute, or wait for the next scheduled poll.
Scheduled polling runs every 5 minutes for every network device that has Auto Polling on and a management address.
The port table
The Switch Ports card lists every port the device reported when it was last polled. Use Search ports... to filter by port name or by the name of the connected device. Click the Port or Traffic header to sort.
| Column | What it shows |
|---|---|
| Port | The port name, with your label for it underneath when you have set one. |
| Speed | The negotiated speed in Mbps or Gbps. |
| Status | Used when a connection is recorded on the port, otherwise Available. |
| Operational Status | Link Up or Link Down. A port without link that will not raise an alert also shows Not in use (it has never had link) or Ignored (you set it to never alert). Hover the badge for the reason. |
| Traffic | A small inbound and outbound graph for the last 6 hours. Click it to open the port's traffic window; the refresh icon next to it reloads the last hour. |
| Connected To | The device and interface at the other end of the cable, for example web01:eth0. Click the name to open that device's details window. |
| Actions | The pencil opens Port monitoring, the link icon opens Connect Port (blue when the port is already connected), and the chart icon opens the traffic window. |
With no ports yet, the table reads No port data available. Configure SNMP and click "Discover Ports" to fetch port information.
Choosing which ports raise alerts
A new switch has many ports with nothing plugged in. Alerting on all of them would bury real outages, so FluxBilling learns which ports are in use: a port counts as in use from the first time it is seen with link. Click the pencil on a port row to open Port monitoring.
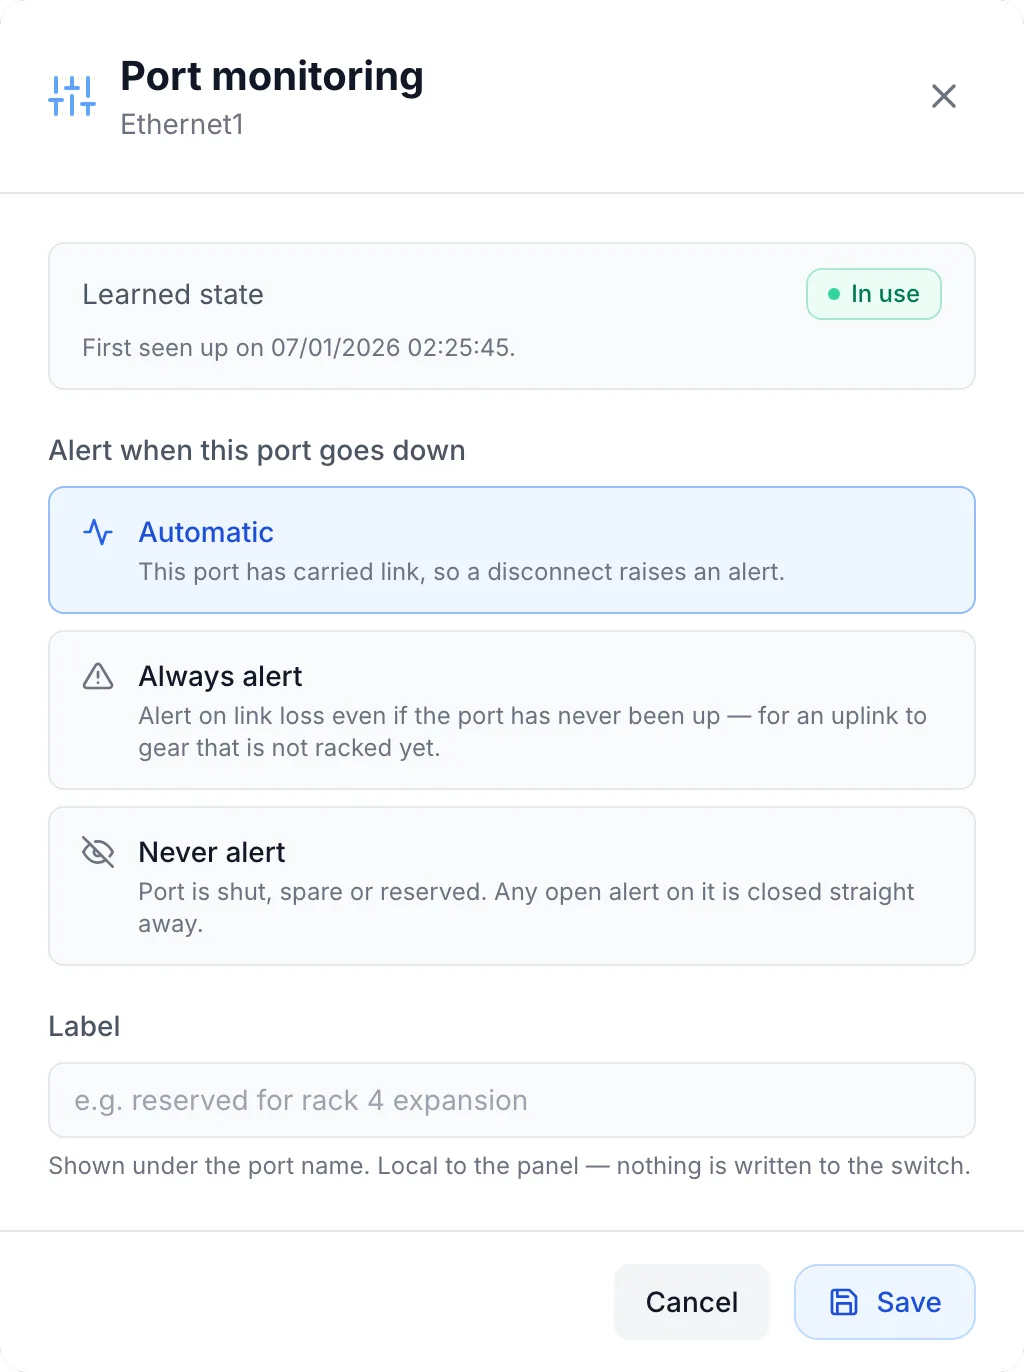
- Learned state: In use with the date the port was first seen up, or Never used.
- Alert when this port goes down:
- Automatic: follows the learned state. A port that has carried link raises an alert when it goes down; a port that never has stays quiet until it comes up for the first time.
- Always alert: alerts on link loss even if the port has never been up, for example an uplink to equipment that is not racked yet.
- Never alert: for a port that is shut, spare or reserved. Any open alert on it is closed straight away.
- Label: up to 150 characters, shown under the port name. It stays in FluxBilling; nothing is written to the switch.
Click Save. The confirmation reads Port monitoring updated. Nothing in this dialog changes the port on the device itself.
These per-port choices work together with the company-wide Port down alerts setting in the Monitoring threshold settings: Only ports that have been in use (recommended), Every port that loses link, or Never alert on port down. Never alert on port down silences every port, and Never alert on a port silences that port under any setting. Otherwise Always alert, or the company-wide Every port that loses link, makes the port alert; in all remaining cases it alerts only once it has been in use. Alerts themselves are raised by the Monitoring module; see Monitoring.
Recording what each port is cabled to
Port connections are your record of the cabling. They fill the Connected To column, mark the port Used, and tell switch automation which switch port belongs to which server.
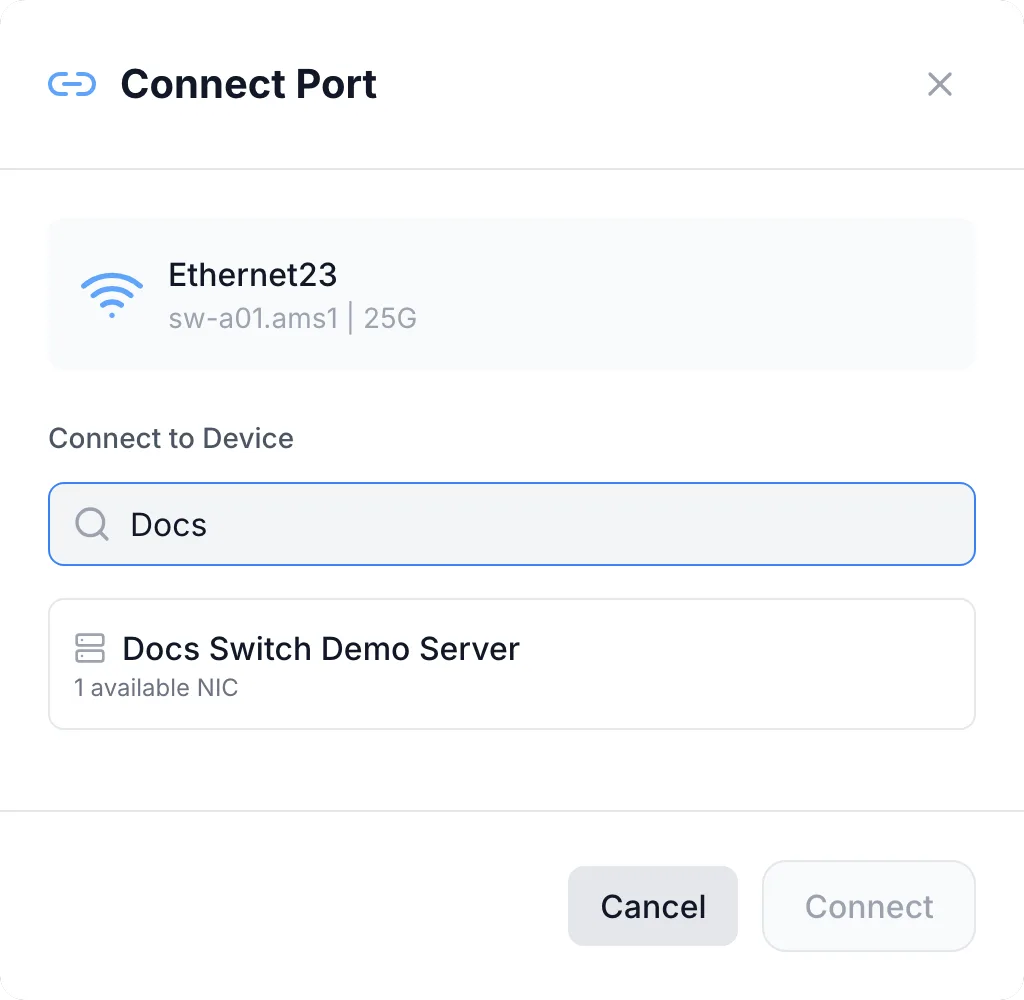
- Click the link icon on the port's row. The Connect Port dialog opens with the port name, the device and the port speed at the top.
- Under Connect to Device, search and choose a device. The list holds dedicated servers, blade chassis, blade servers, switches, routers, firewalls and patch panels, each with a count such as 4 available NICs or 12 available ports.
- Under Select NIC (for a server) or Select Port (for network gear), pick the interface. Interfaces already connected are greyed out.
- Check the summary line Connect to, then click Connect. The confirmation reads Connection created successfully.
To remove a connection, click the blue link icon on a connected port. The dialog becomes Manage Connection and shows what the port is Currently Connected To. Click Disconnect. This only updates the record, not the cable.
You can also start from the other end: in a server's details window, connect one of its network interfaces to a switch port.
Uplinks are never reconfigured. Switch automation only acts on a switch port connected to a dedicated server or a blade. A port connected to another switch, router, firewall or patch panel is treated as an uplink and left alone.
Port traffic
Click a port's small graph or its chart icon to open Port Traffic for that port, with its link state in the title.
- Time Range: 1 Hour, 6 Hours, 24 Hours, 7 Days or 30 Days, plus a Refresh button.
- Bandwidth: inbound and outbound traffic over the range, with Current In, Current Out, Peak In and Peak Out.
- Errors & Discards: errors and discards in each direction, with Total Bytes In, Total Bytes Out, Total Errors and Total Discards. Error and discard totals above zero are highlighted.
Ranges up to 24 hours use every poll. The 7-day and 30-day ranges use hourly averages. Individual polls are kept for 7 days and hourly figures for 90 days.
Device health
When Auto Polling is on, a Device Health card appears with its own range buttons (1H, 6H, 24H, 7D). It shows the latest CPU, Memory and Temp readings as bars, the fan and power supply state, an Aggregate Traffic chart for all ports together, and CPU & Memory and Temperature charts. The bars turn amber and then red at these levels:
| Reading | Amber from | Red from |
|---|---|---|
| CPU | 80% | 95% |
| Memory | 85% | 95% |
| Temperature | 70 °C | 85 °C |
These colours are only a visual cue in this window. Alert thresholds are set in Device monitoring. A reading the device does not report shows N/A. The card keeps working when the Monitoring module is off.
Switch automation drivers
When switch automation is on, FluxBilling configures the switch port of a server as IP addresses are allocated, deployed and released: for example it sets the access VLAN or puts a gateway address on a routed port. It is switched on with Allocate on Switch via SNMP under the IPAM section of Settings → General (Off, Dry-run or On), and it only acts while IPAM is in Automatic mode. Every attempt is listed on the Switch Automation Jobs page.
The driver decides how FluxBilling talks to a switch. Pick it in Switch Automation Driver in edit mode:
| Driver | For | How it configures the port |
|---|---|---|
| Generic Snmp | Any switch with standard SNMP VLAN support | Port state and access VLAN over SNMP. Routed (layer 3) port changes are not supported. |
| Cisco Ios | Cisco IOS and IOS-XE | Port state over SNMP; access VLAN, trunk and routed port changes over SSH. Uses the Enable password when set. |
| Cisco Nxos | Cisco Nexus (NX-OS) | Port state and trunk VLANs over SNMP; access VLAN and routed port changes over SSH. |
| Arista Eos | Arista EOS | Port state and trunk VLANs over SNMP; access VLAN and routed port changes over eAPI when eAPI URL is set, otherwise SSH. |
| Juniper Junos | Juniper Junos | All changes over NETCONF on SSH. |
Default (Generic Snmp) leaves the choice to the company default. You rarely need to pick a driver by hand: when you click Test SNMP or fetch the model of a switch that has no driver yet, FluxBilling recognises Cisco, Nexus, Arista and Juniper switches from their SNMP description and stores the matching driver. Any other switch gets Generic Snmp stored at that point, so it no longer follows the company default; pick a driver by hand if you want a different one. A driver you chose yourself is never overwritten.
Drivers that use SSH log in with the switch's SSH Username, Root Password and SSH Port, through the provisioning agent when there is one.
SSH terminal
Click SSH in the action bar to open a terminal in the browser. Switches connect with their SSH Username (or admin) on their SSH Port; routers and firewalls connect as root on port 22. The password is the stored Root Password. The connection goes through the device's provisioning agent when one is available.
Troubleshooting
| Message or symptom | What it means |
|---|---|
| Please configure SNMP settings first (click Edit) | Test SNMP or Discover Ports was clicked before a community string (SNMPv2c) or username (SNMPv3) was saved. |
| Management IP is required | You fetched the model while the device has no management address. Set Switch IP first. |
| SNMP connection failed: ... | The device did not answer. Check the address, the community string or SNMPv3 credentials, the device's SNMP access list and any firewall in between. For a private management network, check that the provisioning agent for that location is online. |
| Failed to discover ports | The poll did not complete: the device did not answer, a scheduled poll was running at that moment, or the poll took longer than 2 minutes. Wait a moment and try again, after checking the same points as above. |
| Baseline recorded. Click Discover Ports again in ~60s to see traffic rates. | Normal on the first poll. Rates need two polls. |
| No traffic data available for the selected time range. | No polls fall into the range yet. Polling runs every 5 minutes; check that Auto Polling is on, or choose a longer range. |
| No ports found. Run SNMP poll to discover ports. in Connect Port | The chosen switch has never been polled. Open it and click Discover Ports. |
| This switch port is already connected to another device / This server NIC is already connected to another port | Each switch port and each server interface can hold one connection. Disconnect the old one first. |
| The SSH button is greyed out | Hover it: No management IP configured or No SSH password set. |
| SSH terminal access requires admin role | Staff accounts cannot open the terminal. Ask an administrator. |
| Failed to fetch password or Failed to fetch community string | Only super admins can reveal or copy stored secrets. |
| The Switch Automation Driver list only offers Default (Generic Snmp) | The driver list and the other switch automation fields come with IPAM. Turn IPAM on in Settings → General. |
Related articles
- Inventory: adding devices in bulk, fetching details, exporting.
- Rack Management: placing devices in racks.
- Monitoring and Device monitoring: alerts, thresholds and the network overview.
- IPAM and Switch Automation Jobs: address management and the history of switch changes.
- Local agents: reaching devices on private management networks.
- PDUs and Patch panels and cable tracing.
Cisco, Arista and Juniper are trademarks of their respective owners. FluxBilling is not affiliated with them.