
Patch Panels and Cable Tracing
Add patch panels to a rack, record what each port's front and rear connect to, set labels, connectors and status, and trace a cable path.
Patch panels in FluxBilling record what is plugged into each port, on the front and on the rear, so anyone on your team can see where a cable goes without opening the rack. You add a panel to a rack, then document each port: which switch port, server NIC, other patch panel, wall outlet or cross connect it leads to, plus the connector, cable colour, label and status. From any connected port you can open a trace that draws the cable path through that port.
This page is for the staff who run your datacenter documentation. Patch panels are internal records: customers never see them in the client area.
Before you start
- The Locations feature must be on, under Settings → General → Feature Toggles → Locations. Patch panels live on the rack page, which is part of Locations.
- Permissions. Staff need View Locations to open racks and patch panels, and Edit Locations to add panels, connect ports or save changes. See Staff & Permissions.
- A rack to put the panel in. Racks are created on the datacenter page; see Datacenter Details and Rack Management.
- The equipment you want to connect, already in FluxBilling: switches and routers, servers and blades are added on the Inventory page.
Patch panels are passive equipment. They are not counted as dedicated servers on your FluxBilling licence, so you can add as many as you need.
Add a patch panel to a rack
- Open Locations, choose the location, open the datacenter and click the rack.
- In the rack header, click Add Patch Panel.
- Fill in the Add Patch Panel form:
- Name (required): the label shown on the rack block, for example PP-DC1-R01-24P.
- Size (RU) (required): rack units the panel takes, 1 to 48.
- Port Count (required): 1 to 96. The form starts at 24.
- Notes: optional free text.
- Click Create Patch Panel. The message Device created — drag it into a rack slot confirms it.
- The new panel appears in the sidebar under Unassigned Devices → Patch Panels. Drag it onto the U position where it is mounted.
FluxBilling creates every port of the panel, numbered from 1, the moment you save. Port count and size cannot be changed later, so check them before you save. To fix a wrong port count, delete the empty panel and create it again.
In the rack diagram, a patch panel block shows how many of its ports are in use, for example 3/24. A port counts as in use when its front, its rear, or both are connected.
Open the port map
Click a patch panel in the rack diagram, or its card under Unassigned Devices, to open its port map. The header shows the panel name, its manufacturer and model when set, and the number of ports.
Under the header, a summary line counts the ports by state:
- Connected: both the front and the rear are connected.
- Partial: only one side is connected.
- Empty: nothing connected on either side, and the port status is Active.
- Reserved and Faulty: shown only when at least one port has that status.
The window has three tabs: Ports, Connections and Details.
Ports tab
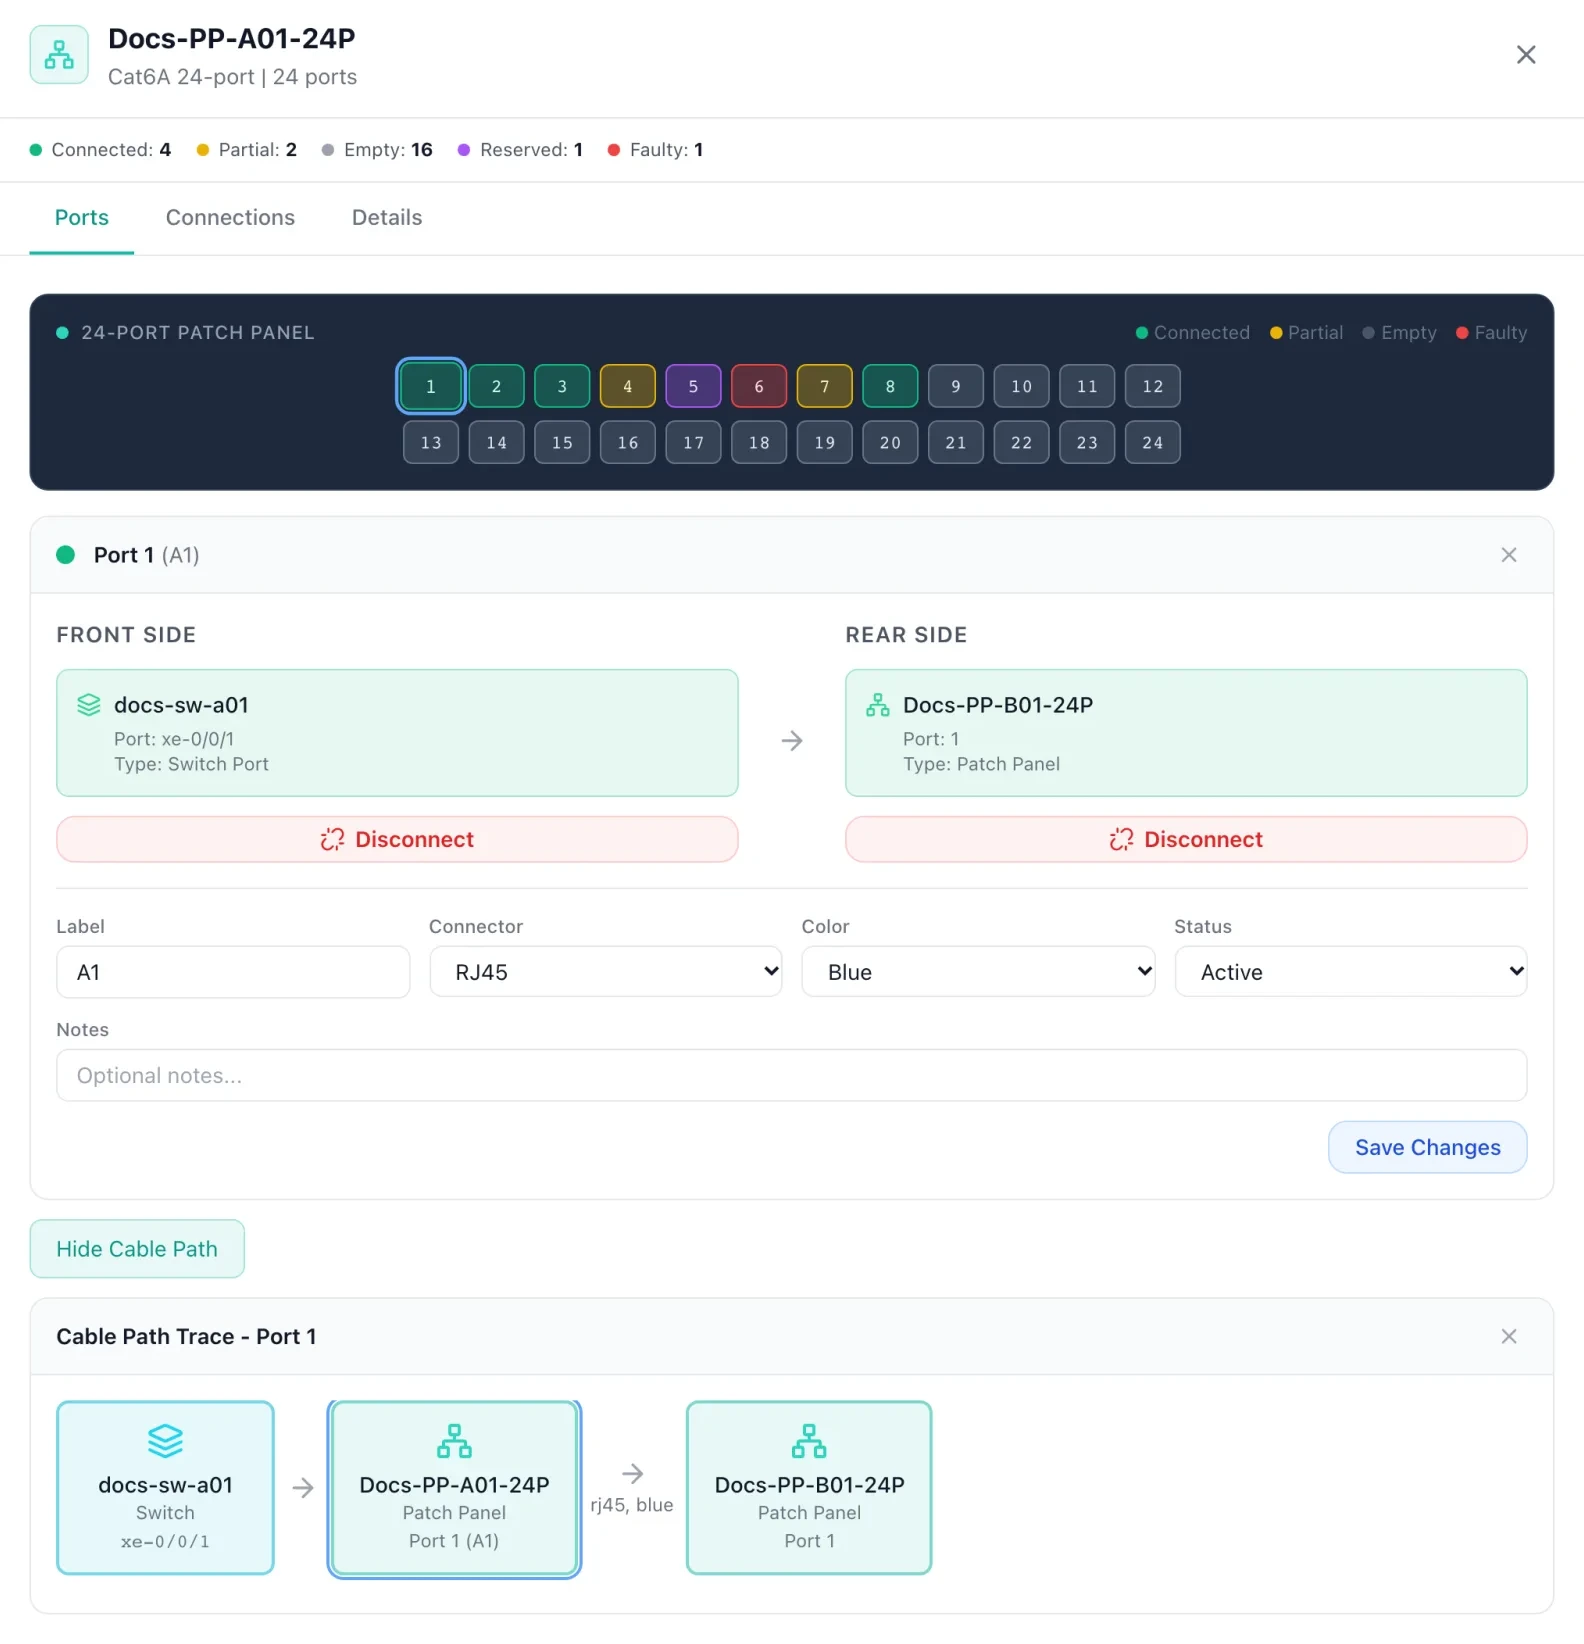
The Ports tab draws the panel as a grid of numbered ports, 12 per row. The colour of each port shows its state:
| Colour | Meaning |
|---|---|
| Green | Front and rear both connected |
| Yellow | Only the front or only the rear connected |
| Slate grey | Empty |
| Red | Status set to Faulty |
| Purple | Status set to Reserved |
| Light grey | Status set to Inactive |
A status of Faulty, Reserved or Inactive overrides the connection colour. Hover over a port to see a summary of its front and rear connections, its connector and colour, and its status when it is not Active. Click a port to open its details below the grid; click it again to close them.
Connections tab
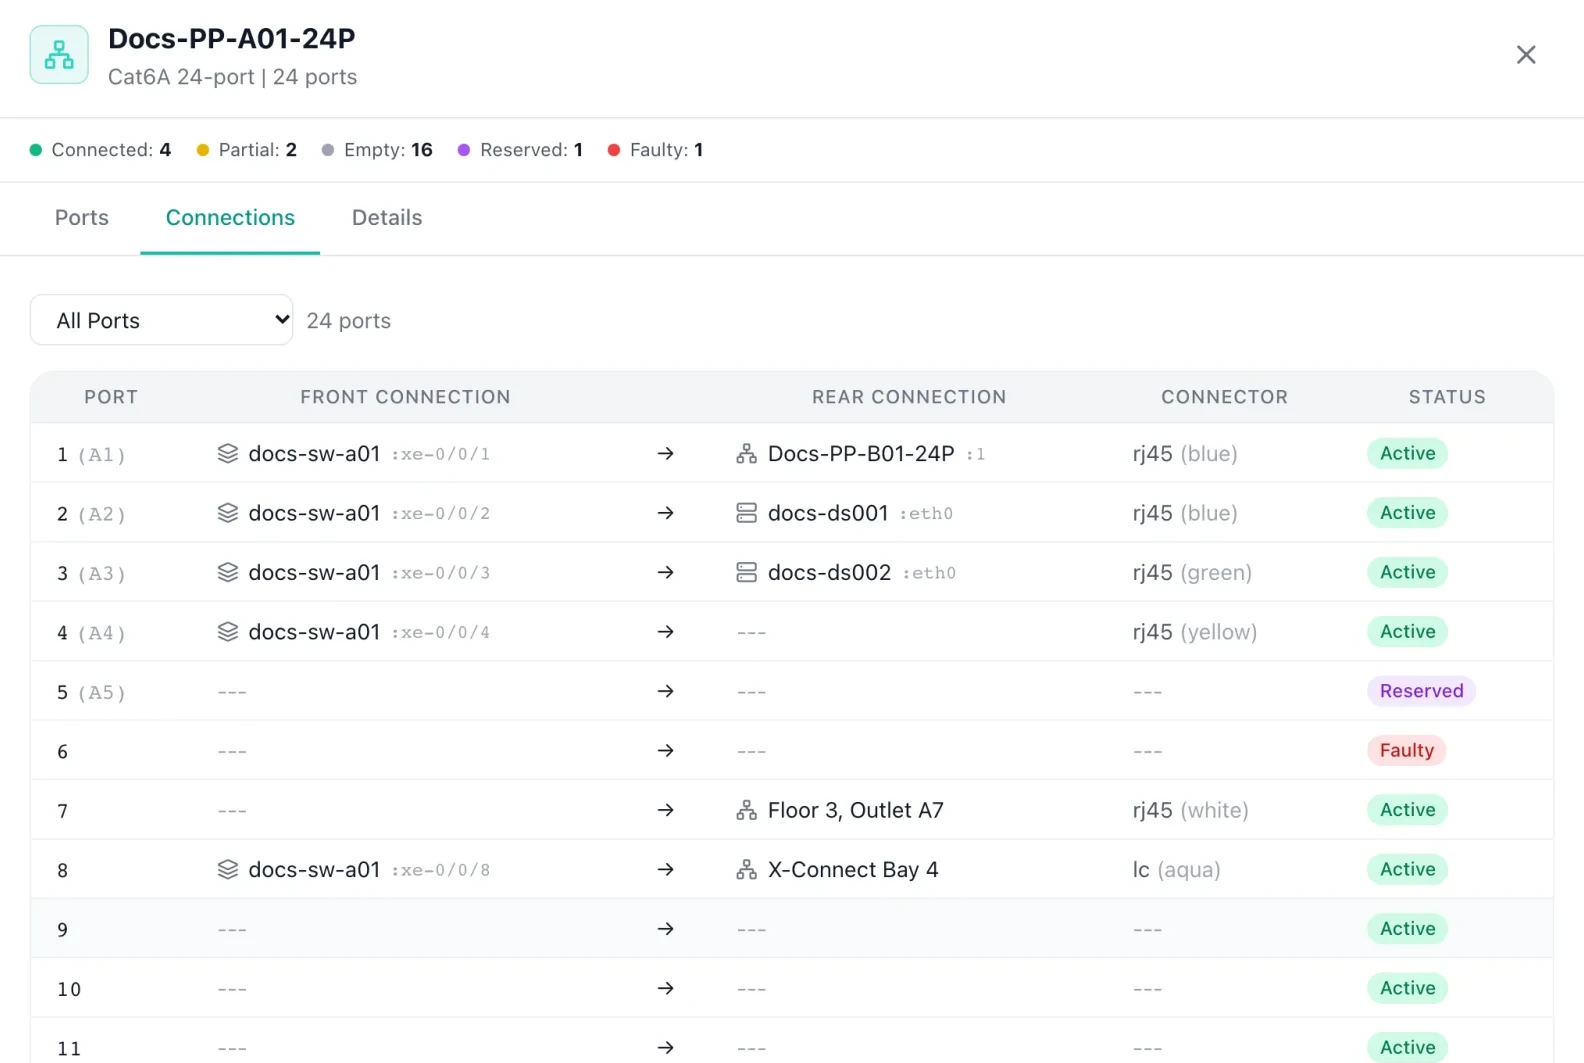
The Connections tab lists every port in a table with the columns Port, Front Connection, Rear Connection, Connector and Status. The port label, when set, appears in brackets next to the number, and each connection shows the device name with the port or NIC after a colon.
Use the drop-down above the table to narrow the list to All Ports, Fully Connected, Partially Connected, Empty, Reserved or Faulty. Click any row to jump to that port on the Ports tab.
Details tab
The Details tab holds the panel's own record: Name (required), Manufacturer, Model, Serial Number, Asset Tag and Notes. Below them, Port Count, Size and Status are shown for reference and cannot be edited here. Click Save Details to store your changes; the message Patch panel updated confirms it.
The same tab has Uninstall from rack, which takes the panel out of the rack but keeps it and all its port records, and Delete, which removes the panel. See Remove a patch panel.
Document a port
Each port has two sides. In FluxBilling, the front side is where you patch towards active network gear, and the rear side is where the permanent cabling runs: to servers, to another patch panel, to a wall outlet or to a cross connect. The arrow between the two sides in the port details shows that order.
Connect the front
- On the Ports tab, click the port, then click Connect Front.
- Pick the type from Select type...: Switch Port, Router Port, Patch Panel or Device NIC.
- Search for the device in Search devices... and click it in the list. The search matches device name and model; on a long list, type part of the name to narrow it.
- Choose the port or NIC on that device (see the table below).
- Click Connect. The button stays greyed out until you choose a port or NIC. The message Front connected confirms it.
Connect the rear
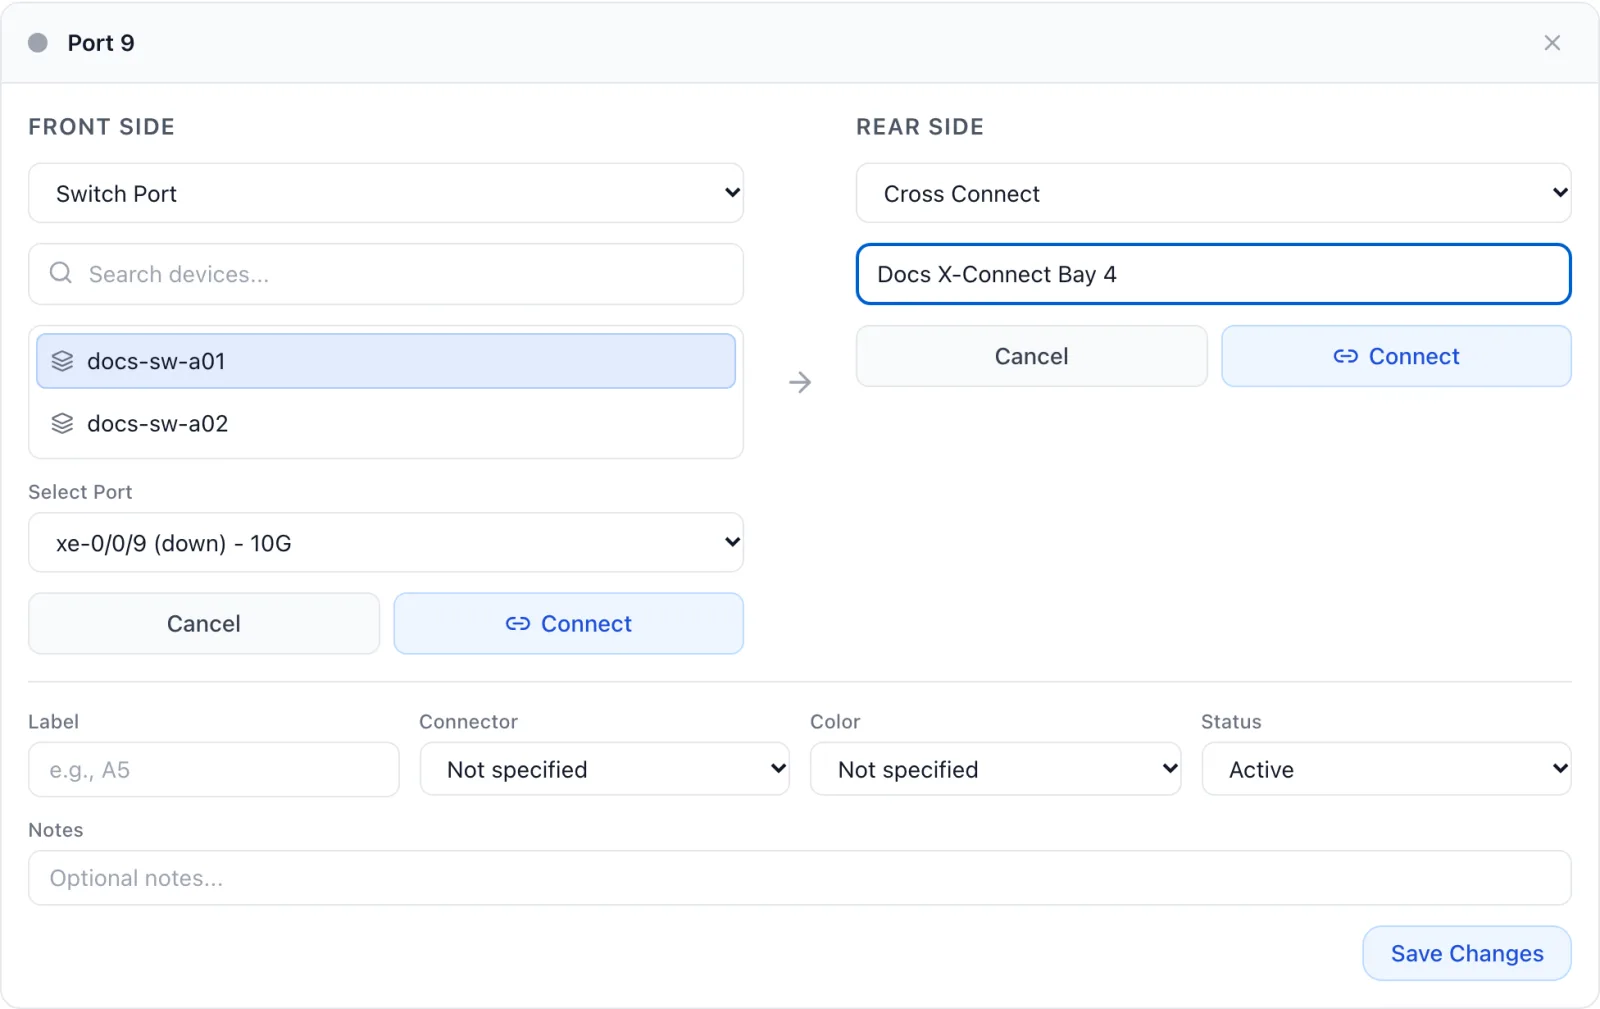
- Click the port, then click Connect Rear.
- Pick the type: Server NIC, Patch Panel, Wall Outlet or Cross Connect.
- For a server or patch panel, search for the device and choose its NIC or port. For a wall outlet or cross connect, type a free-text label instead, for example Floor 3, Outlet A7 or X-Connect Bay 4. The label is optional.
- Click Connect. The message Rear connected confirms it.
| Type | Side | Devices offered | What you choose on the device |
|---|---|---|---|
| Switch Port | Front | Switches | A port from the switch's monitored interface list, shown with its name, link state and speed |
| Router Port | Front | Routers | A port from the router's monitored interface list |
| Device NIC | Front | Dedicated servers, blade chassis and blades | A NIC saved on the server, shown with its MAC address and speed when known. A blade offers one NIC, eth0, with its primary MAC address |
| Server NIC | Rear | Dedicated servers, blade chassis and blades | A NIC, as for Device NIC |
| Patch Panel | Front or rear | Patch panels | A port on the other panel that is free on the opposite side |
| Wall Outlet | Rear | None | A free-text label |
| Cross Connect | Rear | None | A free-text label |
A few rules apply to these lists:
- Switch and router ports come from monitoring. The port list is built from the interfaces FluxBilling has collected for that device. Set up monitoring for your switches first; see Monitoring.
- Server NICs come from the server record. Dedicated servers and blade chassis offer the NICs saved on the server record. A blade offers a single NIC named eth0 with the blade's primary MAC address.
- Patch panel to patch panel links are two-way. When you connect the front of port 5 on panel A to port 12 on panel B, FluxBilling also fills in the rear of port 12 on panel B with panel A, port 5. Connecting a rear works the same way and fills in the other panel's front. That is why the list only offers ports that are free on the opposite side.
Label, connector, colour and status
Under the two sides, each port has its own fields. Click Save Changes to store them; the message Port updated confirms it.
| Field | What it does |
|---|---|
| Label | A short name printed next to the port number everywhere in the port map, for example A5. |
| Connector | Not specified, RJ45, LC (Fiber), SC (Fiber), ST (Fiber), MPO/MTP, SFP, SFP+, QSFP+, BNC or DAC. Shown in the Connector column and on the cable trace. |
| Color | The cable colour: Not specified, Blue, Green, Yellow, Red, Orange, Purple, White, Black, Gray or Aqua. |
| Status | Active, Inactive, Reserved or Faulty. Use Reserved to hold a port for planned work and Faulty for a damaged jack. The status colours the port on the grid. |
| Notes | Optional free text about the port. |
Status is independent of the connections: a Reserved or Faulty port can still have cables recorded on it.
Disconnect a side
A connected side shows the device, its port and the connection type, with a Disconnect button. Click it to clear that side; the message Front disconnected or Rear disconnected confirms it. Disconnecting a patch panel link also clears the matching side on the other panel. To move a cable, disconnect the side first and then connect it again: a connected side cannot be overwritten.
Trace a cable path
When a port has at least one side connected, a Trace Cable Path button appears under its details. Click it to see the cable path for that port, titled Cable Path Trace - Port N.
The trace draws each point on the path as a box with the device name, its type, and the port number or interface. The port you started from has a blue outline. What is connected to its front is drawn on the left and what is connected to its rear on the right, so a typical result reads switch, patch panel, server from left to right. A wall outlet or cross connect shows its label. Where a connector type and cable colour are recorded, they appear under the arrows between the boxes, as stored (for example rj45, blue). Click Hide Cable Path to close it.
Remove a patch panel
- Uninstall from rack on the Details tab, or dragging the panel back onto Unassigned Devices, takes it out of the rack. All ports and connections stay recorded, so you can mount it again elsewhere.
- Delete on the Details tab removes the panel for good. FluxBilling refuses while any port still has a connection on either side. Disconnect every port first, using the Fully Connected and Partially Connected filters on the Connections tab to find them.
Troubleshooting
| Message | Cause and fix |
|---|---|
| Cannot delete patch panel with active connections. Disconnect all ports first. | At least one port still has a front or rear connection. Filter the Connections tab by Fully Connected and Partially Connected, disconnect those sides, then delete. |
| Port front side is already connected. Disconnect first. / Port rear side is already connected. Disconnect first. | The side already holds a connection, often because another user just saved one. Close and reopen the panel to refresh it, disconnect, then connect again. |
| Target patch panel port rear side is already connected / Target patch panel port front side is already connected | The port you picked on the other panel was taken in the meantime. Pick another port. |
| No devices found in the device list | No device of that type matches your search. Check the spelling, or add the device on the Inventory page first. |
| The port drop-down for a switch or router is empty | FluxBilling has no interface data for that device yet. Add it to Monitoring and wait for the first poll. |
| No NIC to choose for a server | For a dedicated server or chassis, no NICs are saved on its record: add them on the server in Inventory. For a blade, the blade has no primary MAC address: set it on the blade. |
| Failed to load patch panel ports | The port map could not be loaded. Close the window and open the panel again. |
Related articles
Rack Management · Datacenter Details · Inventory · Monitoring · Staff & Permissions